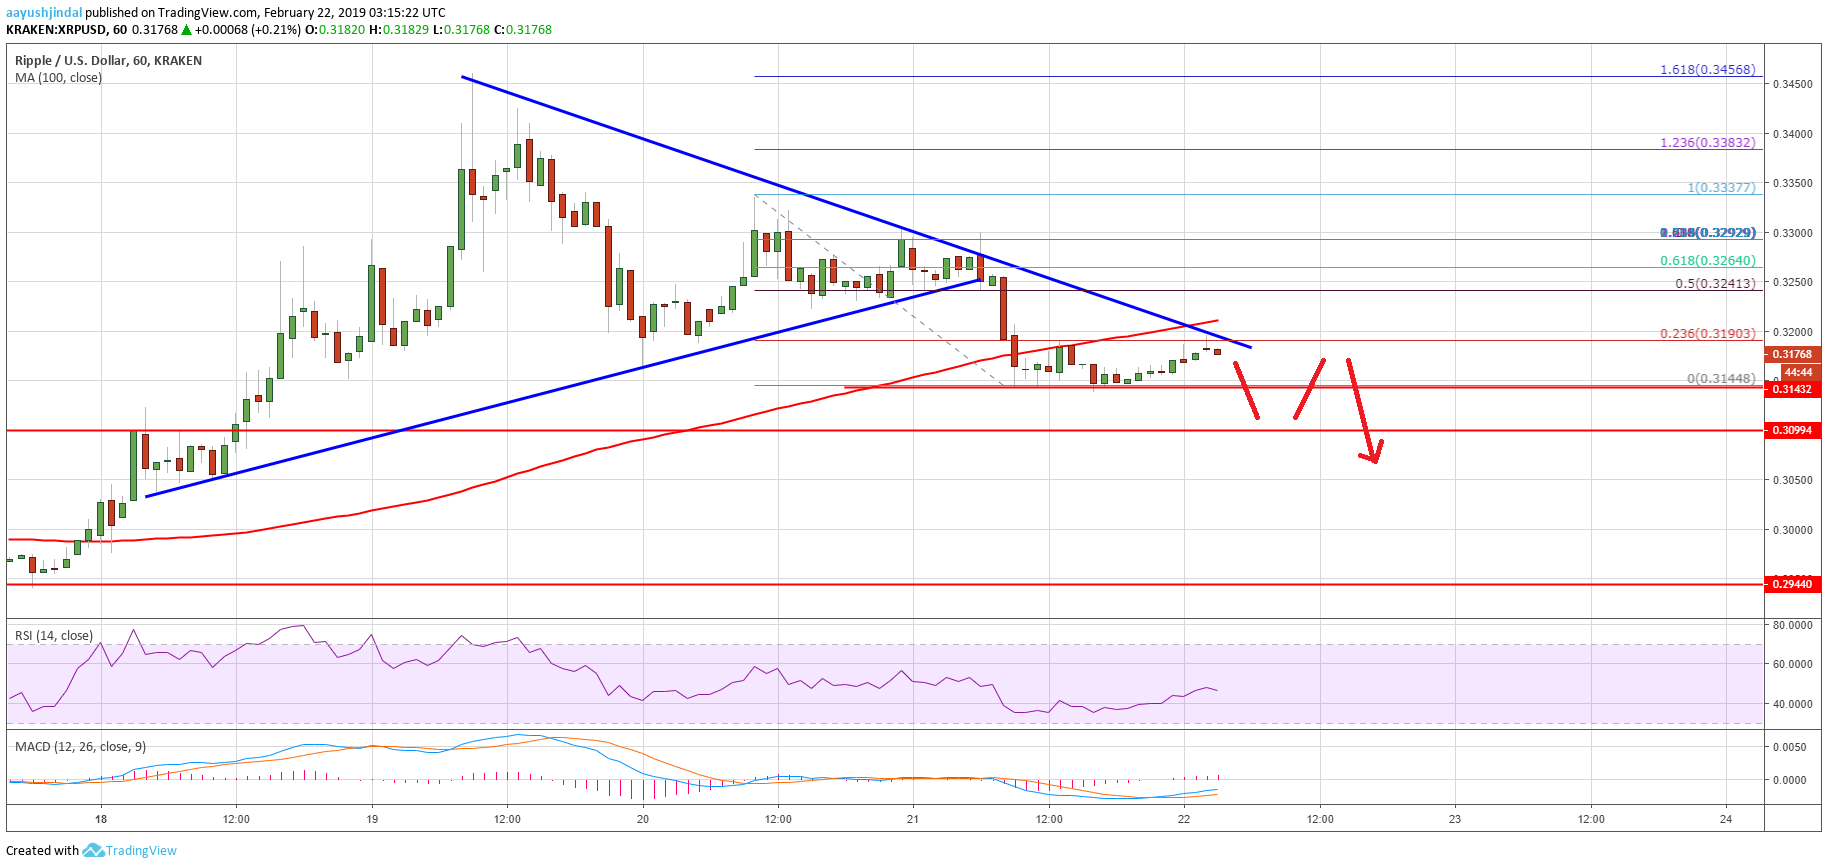
- Ripple price failed to stay above the $0.3250 and $0.3200 support levels and declined against the US dollar.
- This week’s followed major bullish trend line was breached with support near $0.3245 on the hourly chart of the XRP/USD pair (data source from Kraken).
- The pair declined below $0.3200 and tested the next key support near the $0.3140 level.
- The current price action is slightly bearish, suggesting more losses towards the $0.3050 support area.
Ripple price failed to hold gains and declined recently against the US Dollar and bitcoin. XRP/USD could decline towards the $0.3050 support before it can start a fresh upward move.
Ripple Price Analysis
Yesterday, we discussed a few important support levels near the $0.3250 level for ripple price against the US Dollar. Recently, the XRP/USD pair started a downside move from well above the $0.3400 level and declined below the $0.3300 and $0.3280 supports. Later, the price found a strong support near the $0.3250 level. More importantly a crucial breakout pattern was formed with support near $0.3250. However, buyers failed to hold gains, resulting in a sharp decline below $0.3250.
During the decline, the price broke the $0.3220 support and the 100 hourly simple moving average. Besides, this week’s followed major bullish trend line was breached with support near $0.3245 on the hourly chart of the XRP/USD pair. The pair even traded below $0.3160 and tested the $0.3150 support. A low was formed at $0.3144 and the price is currently correcting higher. It is testing the 23.6% Fib retracement level of the recent drop from the $0.3337 high to $0.3144 low. However, there are many hurdles on the upside near the $0.3190 and $0.3200 levels.
There is also a bearish trend line in place with resistance near $0.3200 and the 100 hourly SMA. Therefore, a successful break above $0.3200 is needed for a decent recovery. The next resistance could be $0.3250 and the 50% Fib retracement level of the recent drop from the $0.3337 high to $0.3144 low.

Looking at the , ripple price likely moved into a bearish zone below the $0.3250 support level. The current price action is slightly bearish, suggesting more losses towards the $0.3050 support area. Having said that, losses could be limited and sooner or later the price may bounce back above $0.3200. Finally, a close above $0.3250 will most likely boost the market sentiment in favor of buyers.
Technical Indicators
Hourly MACD – The MACD for XRP/USD recovered and moved back in the bullish zone.
Hourly RSI (Relative Strength Index) – The RSI for XRP/USD recovered recently, but failed near the 50 level.
Major Support Levels – $0.3150, $0.3140 and $0.3100.
Major Resistance Levels – $0.3200, $0.3240 and $0.3250.


