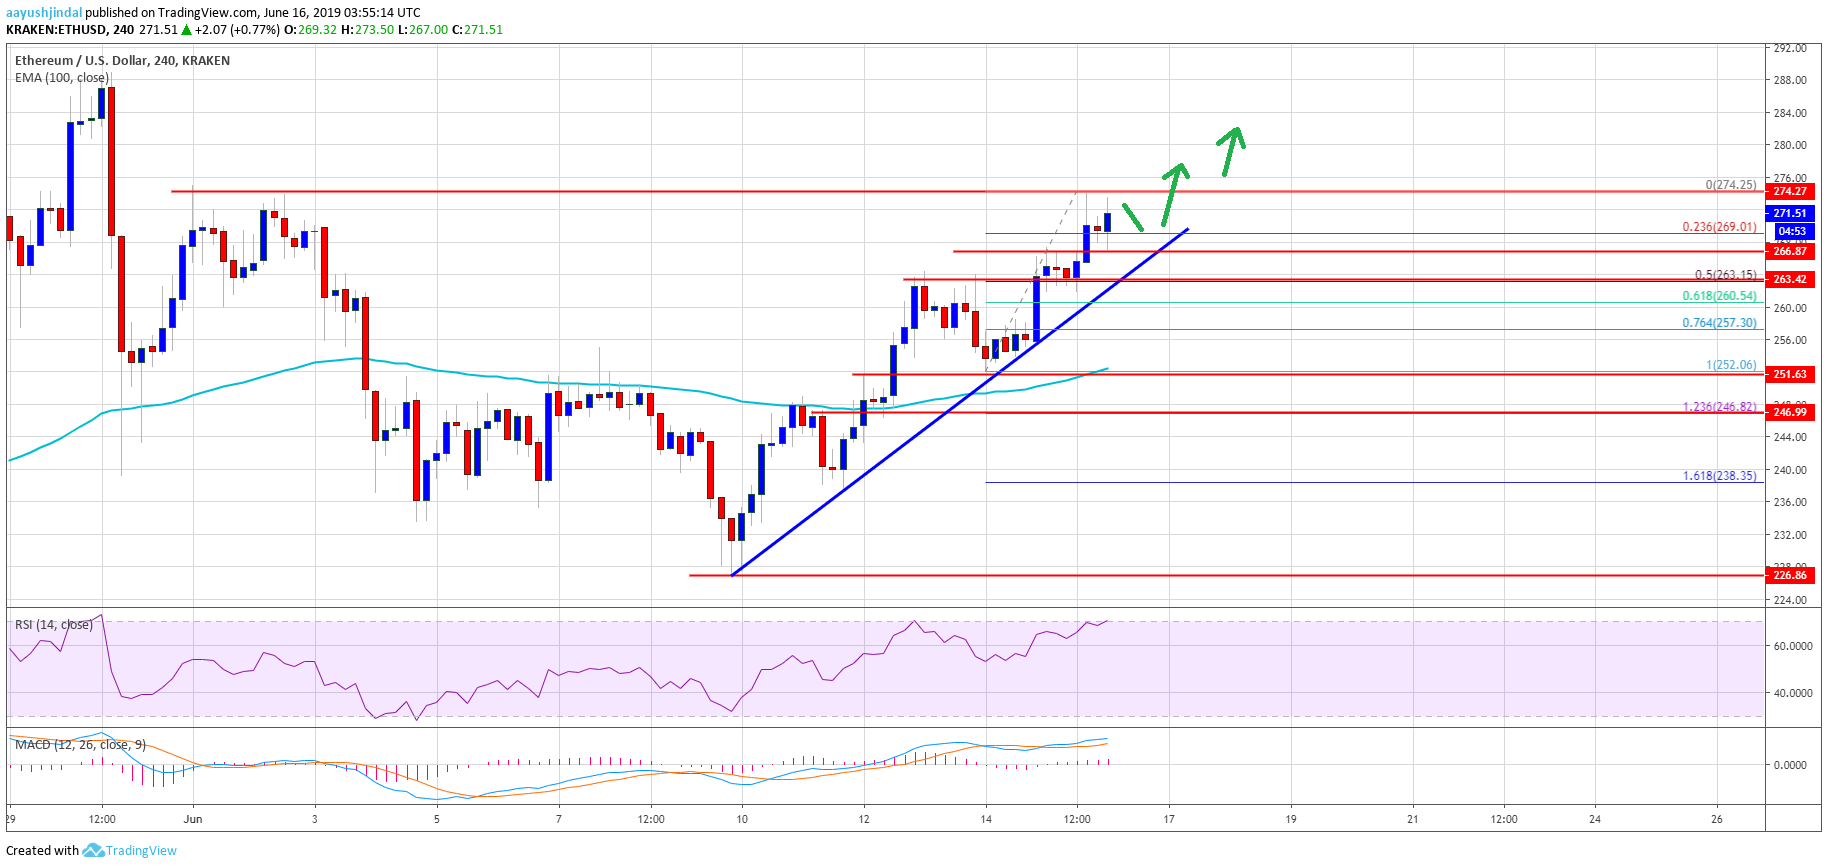
- ETH price rallied recently and broke the $260 and $265 resistance levels against the US Dollar.
- The price is currently trading near the key $275 resistance, above which it could rally further.
- There is a major bullish trend line forming with support at $265 on the 4-hours chart of ETH/USD (data feed via Kraken).
- The pair is likely to break the $275 resistance and it could even test the $300 resistance area.
Ethereum price is gaining bullish momentum against the US Dollar, similar to bitcoin. ETH is likely to accelerate higher towards the $290 and $300 resistance levels in the near term.
Ethereum Price Weekly Analysis
This past week, Ethereum price started a steady rise from the $230 support area against the US Dollar. The ETH/USD pair broke many resistances, including $245 and $250. There was also a close above the $250 resistance and the 100 simple moving average (4-hours). Moreover, the price rallied above the $260 resistance and recently tested the key $275 resistance area.
A swing high was formed at $274.25 and the price is currently trading with a positive bias. An initial support is near the 23.6% Fib retracement level of the last wave from the $252 low to $274 swing high. Moreover, there is a major bullish trend line forming with support at $265 on the 4-hours chart of ETH/USD. If there is a downside break below the trend line, the price could even break the $262 support area. An intermediate support is near the 50% Fib retracement level of the last wave from the $252 low to $274 swing high.


