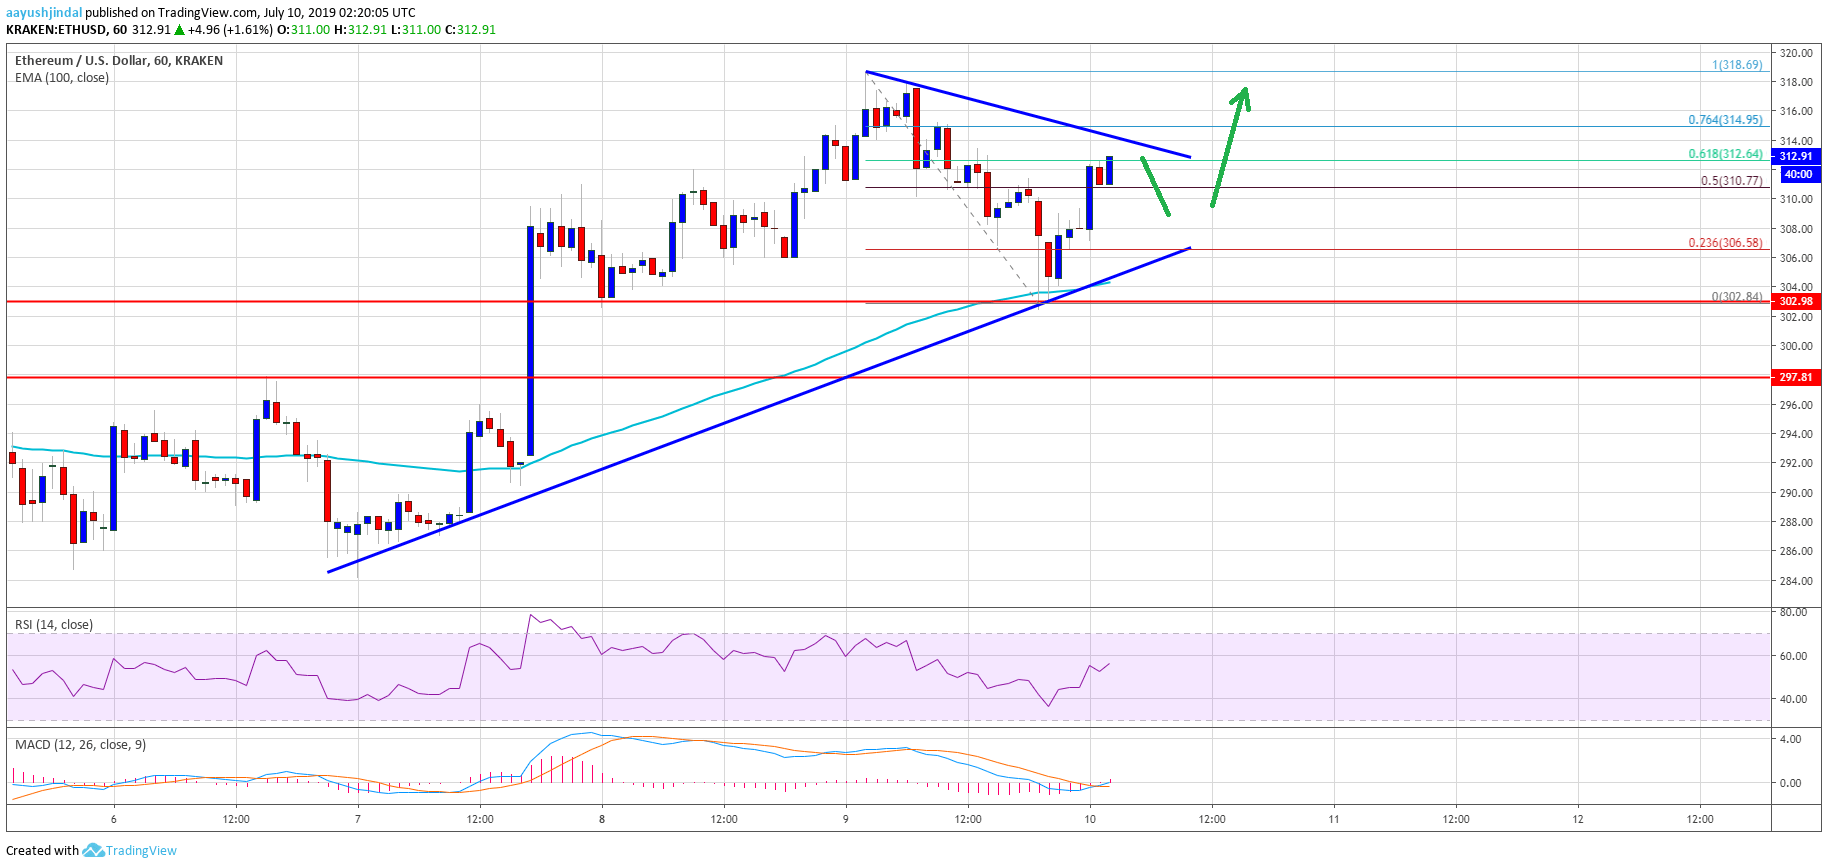
- ETH price is gaining momentum above the $310 resistance area against the US Dollar.
- The price must break the $315 resistance area to climb above the $320 resistance zone.
- There is a breakout pattern forming with resistance near $314 on the hourly chart of ETH/USD (data feed via Kraken).
- On the downside, there are a few important supports near the $306 and $302 levels.
Ethereum price is likely to break the $320 resistance area versus the US Dollar, but struggled vs bitcoin. ETH price remains well supported on the downside as long as above $302.
Ethereum Price Analysis
After yesterday’s rise, there were further gains in bitcoin price above $12,500 against the US Dollar. BTC/USD even broke the $13,000 resistance area (as discussed in yesterday’s analysis). On the other hand, there was no new weekly high in Ethereum, but it remained stable above the $300 and $302 support levels. Earlier, it started a downside correction from the $318 swing high and traded below the $310 support area.
However, the $302 support zone acted as a strong support along with the 100 hourly simple moving average. A swing low was formed at $302.80 and the price recently climbed back above the $306 and $308 levels. Moreover, it recovered above the 50% Fib retracement level of the recent decline from the $318 high to $302 swing low. It is now trading nicely above the $310 level.ETH Technical Indicators
Hourly MACD – The MACD for ETH/USD is moving back in the bullish zone, with a positive bias.
Hourly RSI – The RSI for ETH/USD is currently well above the 55 level, with a positive angle.


