The bitcoin-to-dollar exchange rate surged by as much as 0.80 percent to establish an intraday high of $7,263.31. The move uphill accompanied a moderate rise in volume.
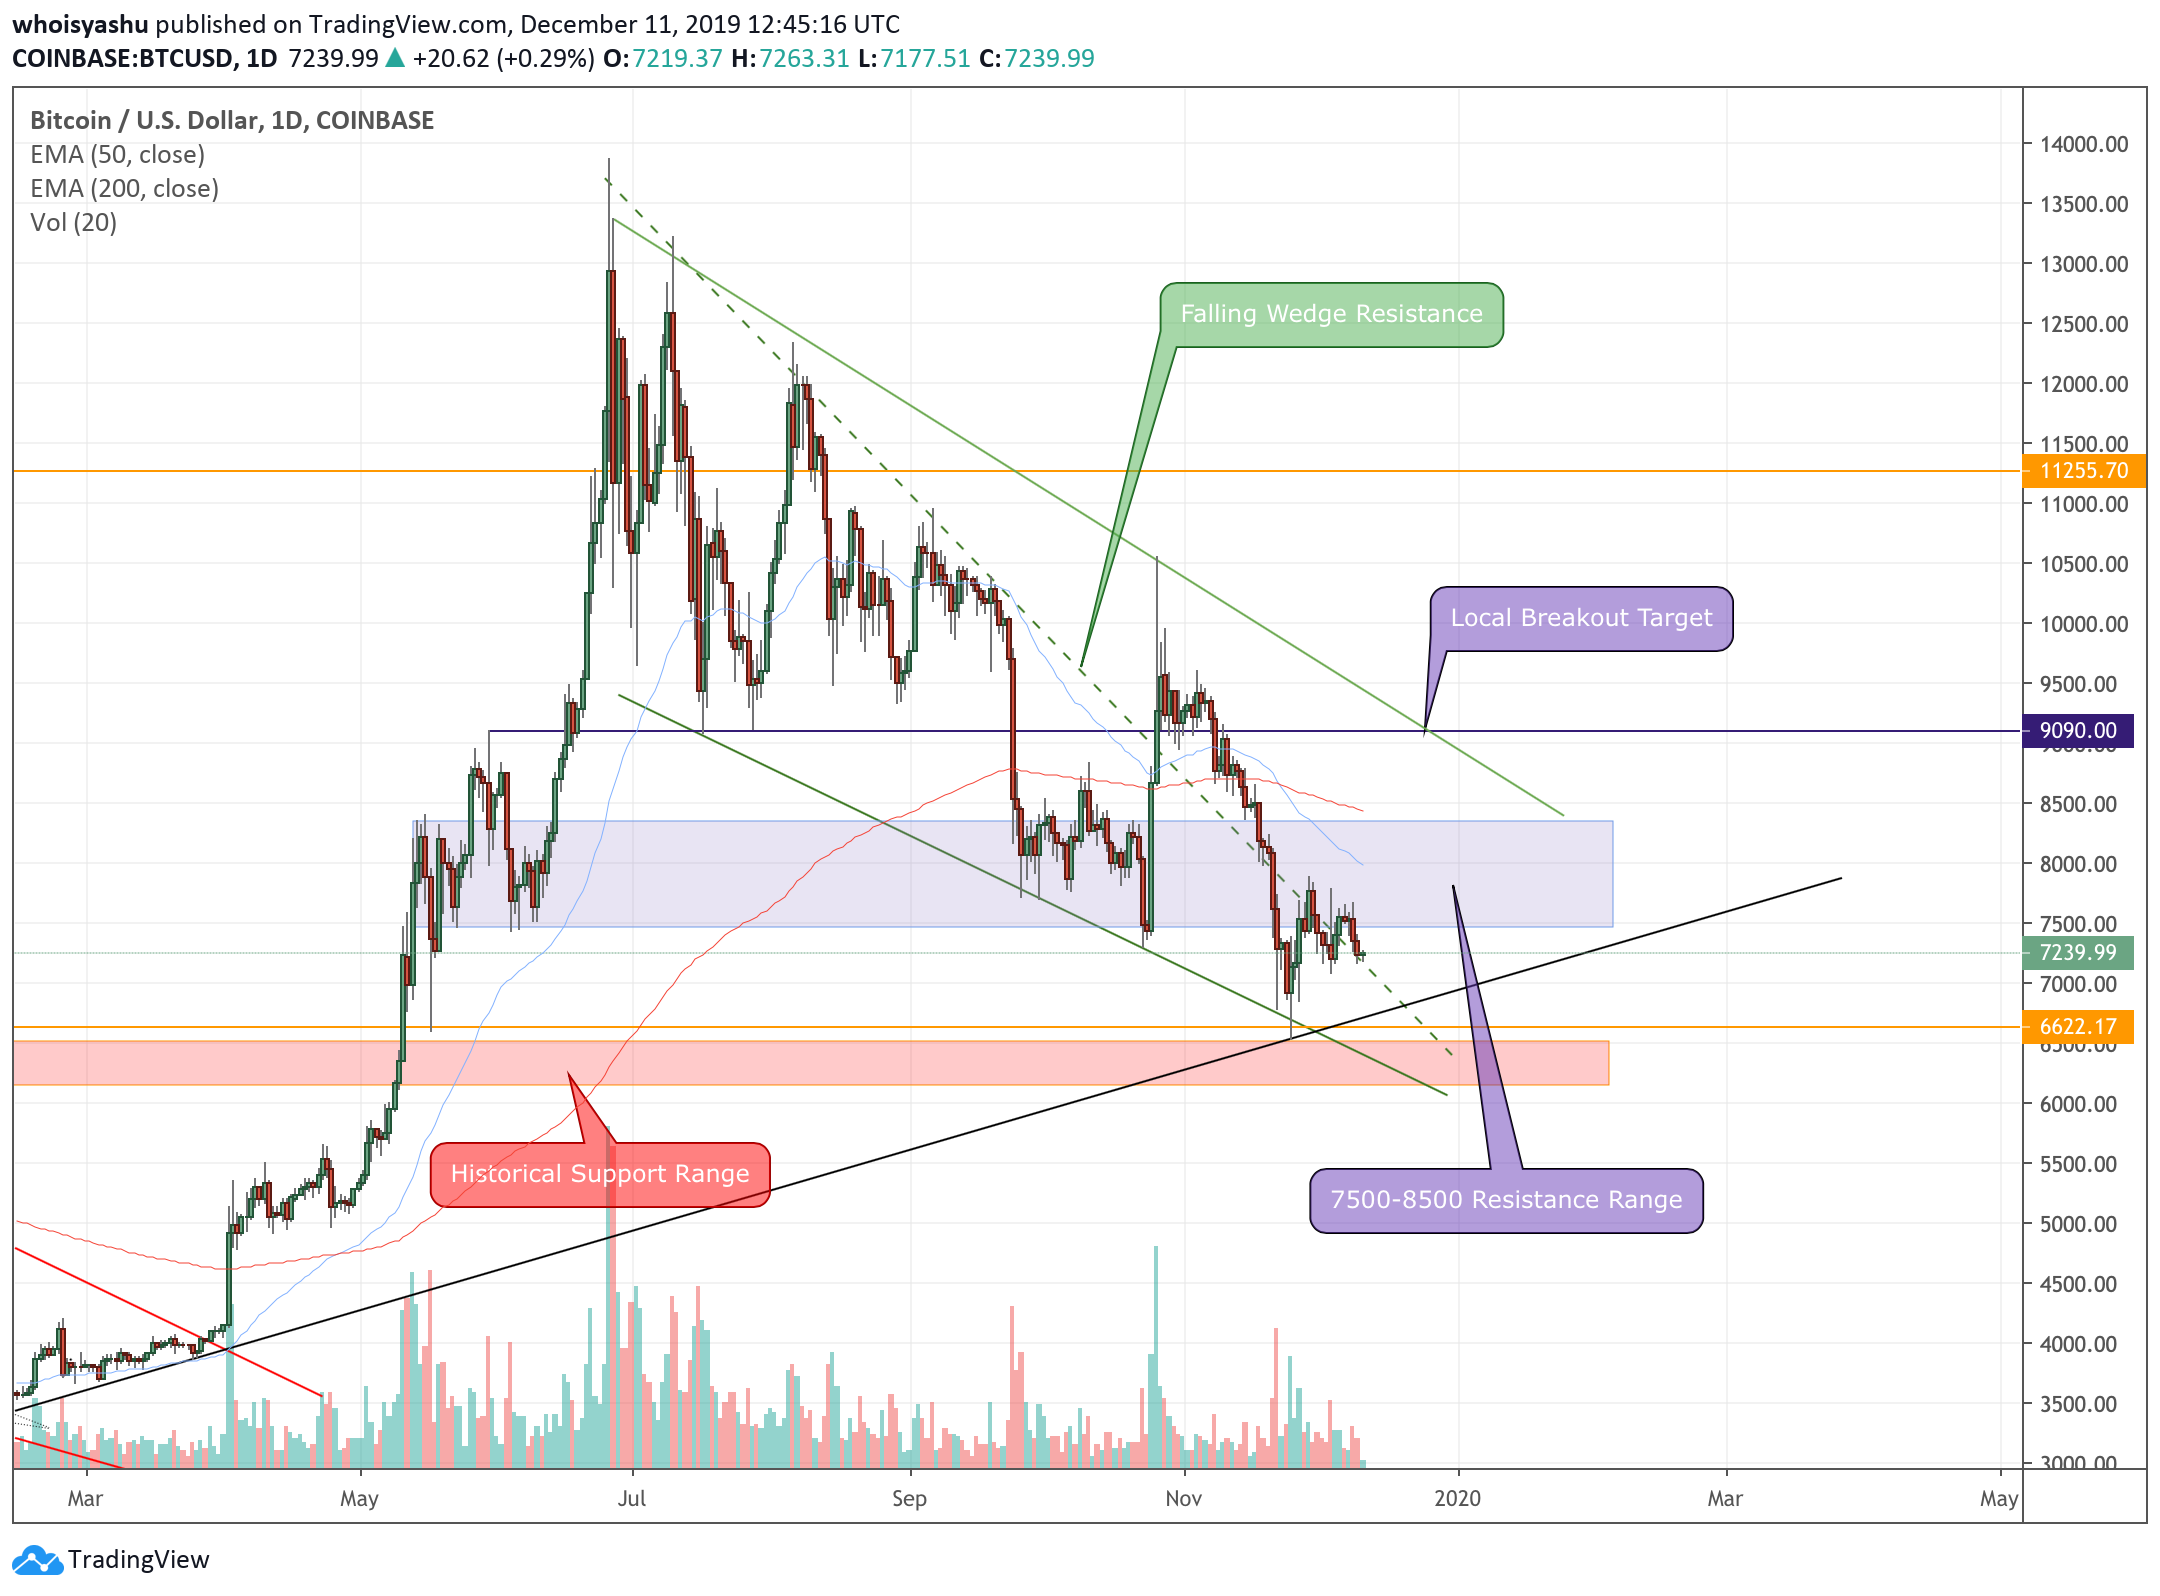
The conformity between price and volume showed traders’ inclination to retest the strong resistance area lurking above $7,500. Nevertheless, the possibility of bitcoin jumping above the purpled ceiling (in the chart below) remains meager given the prevailing bearish trend.
At the same time, the bitcoin price has stabilized above $6,500, a support level it established during its last move downhill. Bears, for now, are waiting for whales to open extended short positions towards the redded area.
Bulls too are looking for bigwigs to launch giant long positions to close above the purpled area. It’s a classic wait-and-watch approach for small traders.Bullish Calls
The price consolidation also comes at the time when Bakkt, an Intercontinental Exchange-backed digital assets platform, has announced two new bitcoin products for institutional investors.
Central banks may benefit from buying Bitcoin and gold in addition to their stablecoin and payments research. The introduction of new payment rails may not hedge for catastrophic failures in the underlying money itself. Bitcoin and gold may be the hedge central banks truly need. — Gabor Gurbacs (@gaborgurbacs)
“This sudden shift in the supply curve will most likely be the catalyst for the next bitcoin bull run,” he said.
Bitcoin Trade Setup
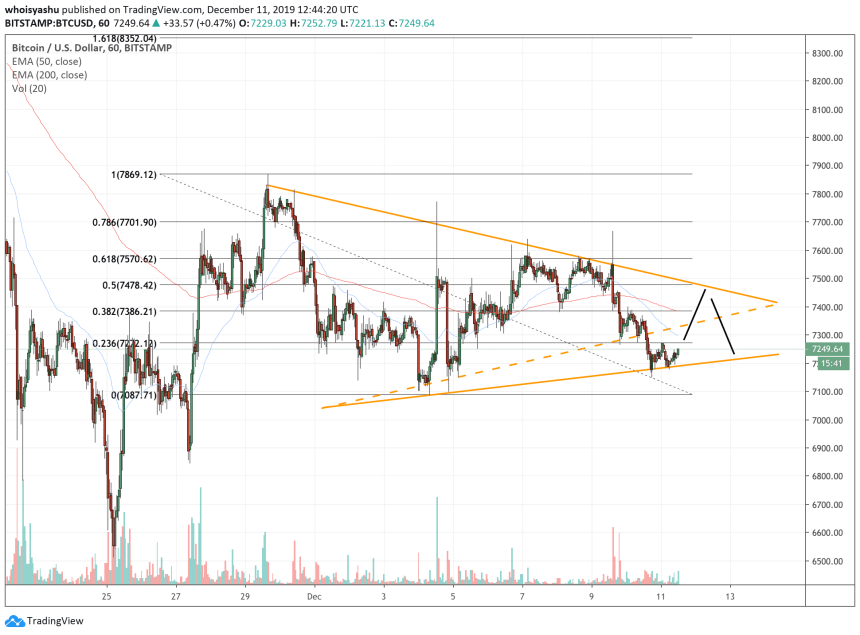
Long-term calls aside, bitcoin is likely to continue in the direction of its previous trend, which is bearish. On an hourly chart, the cryptocurrency remains capped under a descending trendline (the falling oranged trendline in the chart below). At the same time, the price appears to be struggling when it comes to finding a solid floor.
As NewsBTC covered earlier, the bitcoin price was trending inside a Symmetrical Triangle, confirmed by two converging trendlines. The asset earlier broke below two Triangle supports (one of them is shown via hashed oranged trendline in the chart above).
That brought the price to a new price floor, confirmed by five bounce-back attempts during the Wednesday trading session. If the support holds this time, bitcoin could retest the Triangle resistance (the oranged descending trendline). Such a move could have traders enter a long entry towards $7,400-7,500 area. Still, they could maintain a stop-loss order below the new Triangle support (the oranged ascending trendline) to reduce their risks. Larger timeframes, meanwhile, indicate a rundown towards the redded area shown in the first chart. That said, a break below the Triangle support could open an interim short opportunity towards $7,100. A further break could have traders extend the same position towards $6,500. It is important to place a stop loss at or above $7,200 to minimize potential losses in the event of a trend reversal.[Disclaimer: The opinions expressed in this article are of the author and author’s only. NewsBTC holds no responsibilities for any losses incurred. Readers’ discretion is advised.]


