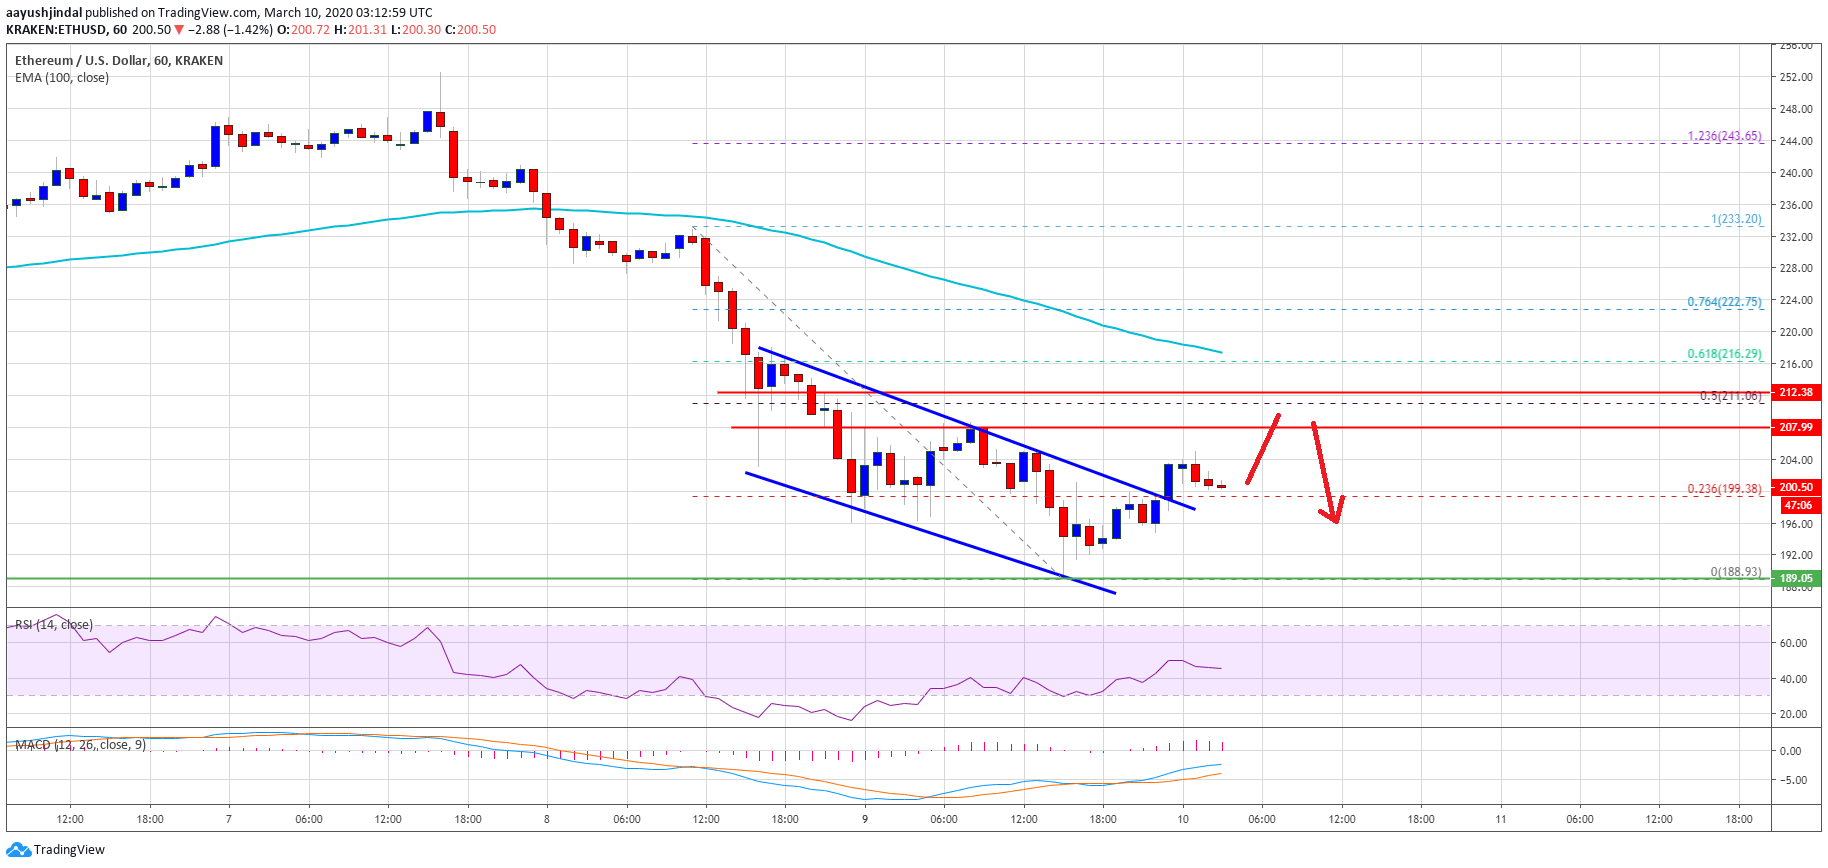
Ethereum is extended its decline below the $200 support area against the US Dollar. ETH price traded as low as $188 and it is currently correcting higher towards $205 and $208.
- Ethereum is currently recovering losses from the $188 monthly low against the US Dollar.
- The price is likely to face a lot of hurdles on the upside near $208 and $212.
- There was a break above a major declining channel with resistance near $199 on the hourly chart of ETH/USD (data feed via Kraken).
- Bitcoin price is now trading well below the $8,000 level, with a bearish angle
Ethereum Price Facing Hurdles
Yesterday, we saw a massive 15% decline in Ethereum below the $220 and $215 support levels against the US Dollar. ETH price even spiked below the $200 handle and settled well below the 100 hourly simple moving average.
A new monthly low is formed near the $188 level and the price is currently correcting higher. There was a break above the $195 level, plus the 23.6% Fib retracement level of the downward move from the $233 high to $188 low.
Moreover, there was a break above a major declining channel with resistance near $199 on the hourly of ETH/USD. Ethereum is now trading near the $200 level and facing a lot of hurdles on the upside.

An initial resistance is near the $205 level. The first major resistance is near the $208 and $212 levels (the recent breakdown zone). The 50% Fib retracement level of the downward move from the $233 high to $188 low is also near the $212 level to act as a major hurdle.
Any further gains could lead the price towards the $218 resistance level and the 100 hourly simple moving average, where the bears are likely to take a stand. A successful break and close above $220 is needed to start a fresh increase in the near term.
More Losses?
If Ethereum fails to recover above the $208 and $212 resistance levels, it could start another decline. An initial support is near the $195 level, below which there is a risk of more losses towards $185.
A downside break below the $185 level may perhaps be seen as a major bearish signal and it could lead the price towards the $150 zone in the coming days.
Technical Indicators
Hourly MACD – The MACD for ETH/USD is about to move back into the bearish zone.
Hourly RSI – The RSI for ETH/USD is currently struggling to move above the 50 level.
Major Support Level – $195
Major Resistance Level – $212


