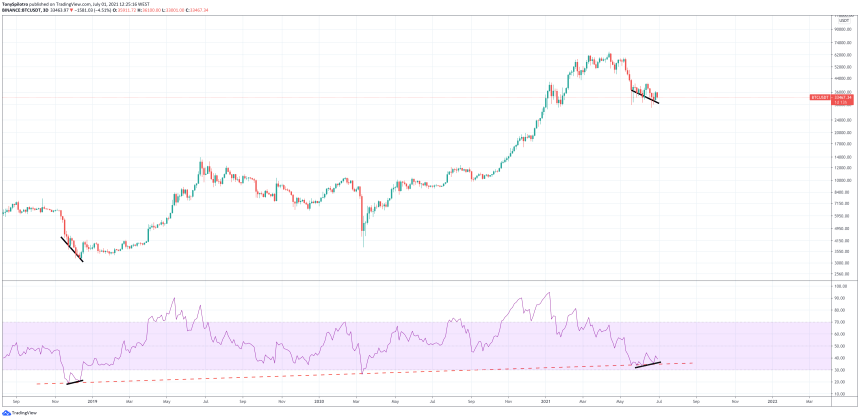
Bitcoin price continues to struggle to regain any type of bullish momentum, and keeps grinding at repeatedly tested support. In the past, when this happens, the support ultimately breaks down and a cascade of liquidations begin.
However, there’s a bullish signal brewing that is thus far the best hope for further continuation to the upside. The reason for the hope, is because the last time Bitcoin gave such a signal, it was the bear market bottom and that support eventually held for good. Could it happen again during the bull phase of the market cycle?Crypto Market Price Action Potentially Feigns Weakness While Buyers Load Up
Bitcoin price is in a dangerous spot, down more than 50% from local highs, but unable to regain its footing. Each meager attempt to recover has been met by another selloff and fall to support.
Related Reading | The Missing Ingredient From A Full On Bitcoin Reversal
That is unless although price action looks weaker, buying is actually gaining strength. And that’s exactly what the Relative Strength Index suggests on the three-day timeframe.

A bullish divergence has formed on the three-day Relative Strength Index | Source:
Bullish Divergence Matches Bitcoin Bear Market Bottom
The Relative Strength Index, or RSI, measures the strength of an asset compared to price action, and can tell analysts when an asset is oversold or overbought. These conditions can lead to a reversal, or provide other intel about the price action.
After such a deep selloff, Bitcoin still hasn’t reached into oversold territory, but it has found support at a rising trend line that dates back to the bear market bottom. The only other time this trend line was touched between then and now, was on Black Thursday.
Related Reading | Analyzing The Critical Bitcoin June 2021 Monthly Close
If the rising RSI trend line holds, support in price action might also do the same. And if it does, there’s a chance a similar reaction could result. Following each touch of this trend line has followed with months of powerful uptrend.It is only when these impulses end does Bitcoin comes crashing back down, and the RSI touches down again. At the same time price action hits the trend line, there’s also a bullish divergence – a signal that also was visible during the bear market bottom. Could it once again be indicating a bottom is in, but the bottom of the bull market?
//twitter.com/tonyspilotrobtc/status/92768009?s=12 Breaking below a trend line that supported both past bottoms could be disastrous, so whatever the conclusion, it should yield significant results.Follow or via . Content is educational and should not be considered investment advice.
Featured image from iStockPhotos, Charts from TradingView.com


