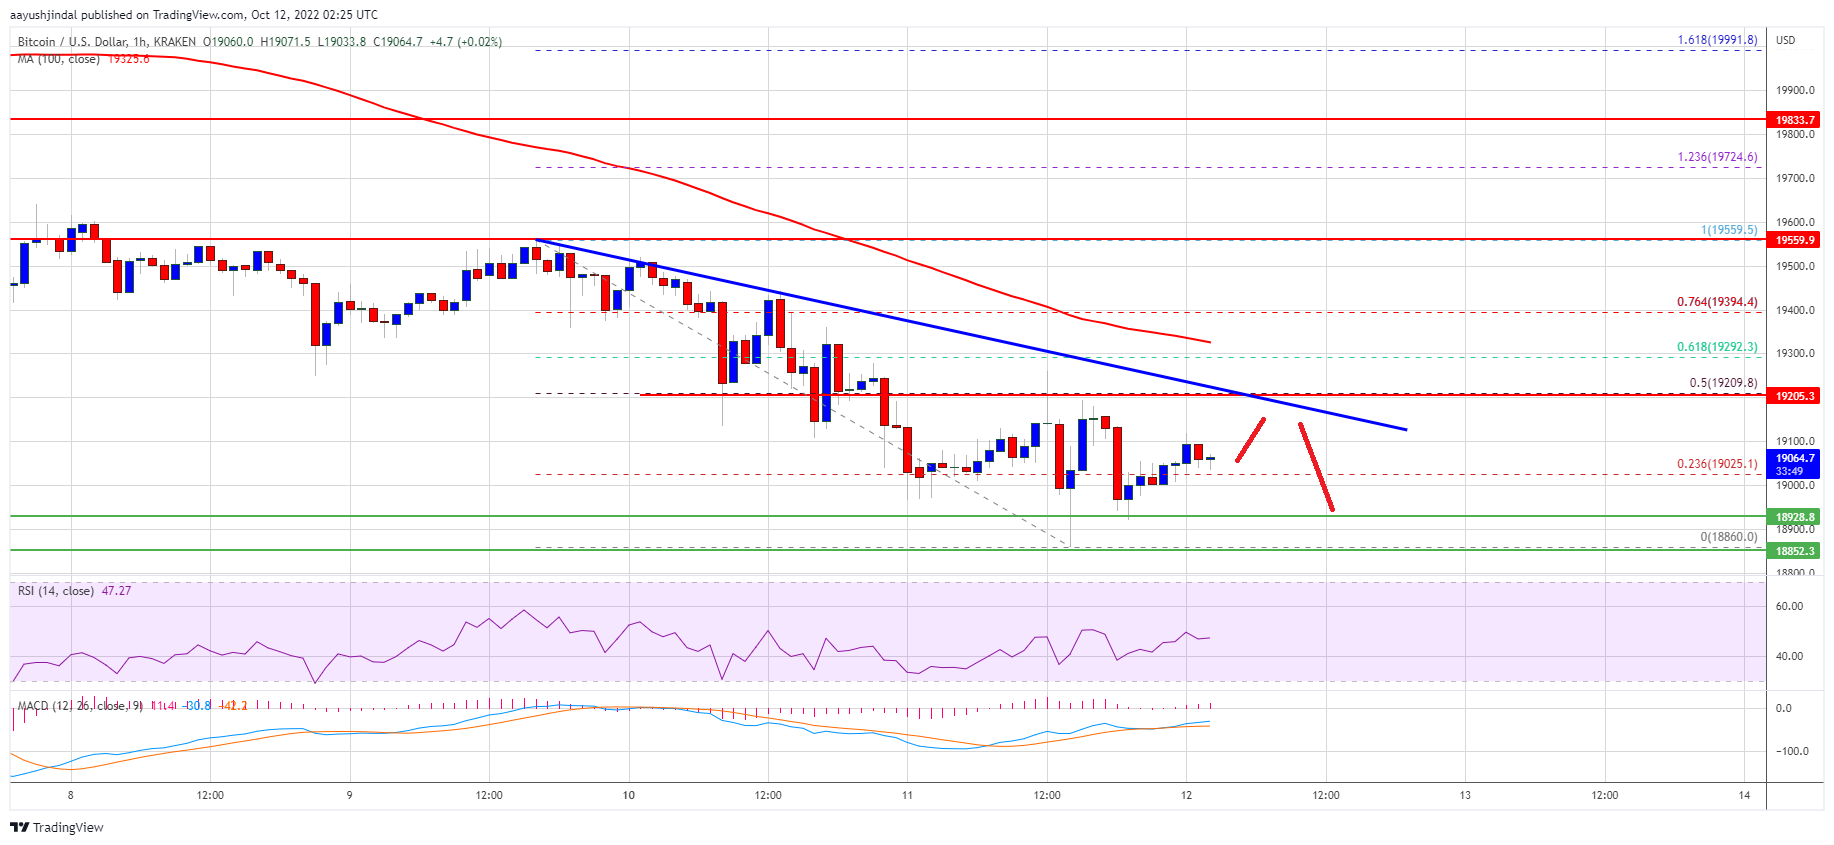
Bitcoin price is struggling below the $19,200 support against the US Dollar. BTC remains at a risk of more losses below the $18,500 support in the near term.
- Bitcoin is showing bearish signs below the $19,200 and $19,500 levels.
- The price is trading below above $19,500 and the 100 hourly simple moving average.
- There is a key bearish trend line forming with resistance near $19,180 on the hourly chart of the BTC/USD pair (data feed from Kraken).
- The pair could continue to move down if it stays below the $19,500 level for a long time.
Bitcoin Price Slides Further
Bitcoin price settled below the $20,000 support zone. BTC is following a slow and steady decline below the $19,500 pivot level and the 100 hourly simple moving average.
The price even traded below yesterday’s low and tested the $18,850 zone. A low is formed near $18,860 and the price is now consolidating losses. There was a minor recovery wave above the $19,000 resistance level. The price climbed above the 23.6% Fib retracement level of the recent decline from the $19,560 swing high to $18,860 low.Bitcoin price is now trading below above $19,500 and the 100 hourly simple moving average. On the upside, an immediate resistance is near the $19,200 level.
There is also a key bearish trend line forming with resistance near $19,180 on the hourly chart of the BTC/USD pair. The trend line is near the 50% Fib retracement level of the recent decline from the $19,560 swing high to $18,860 low.


