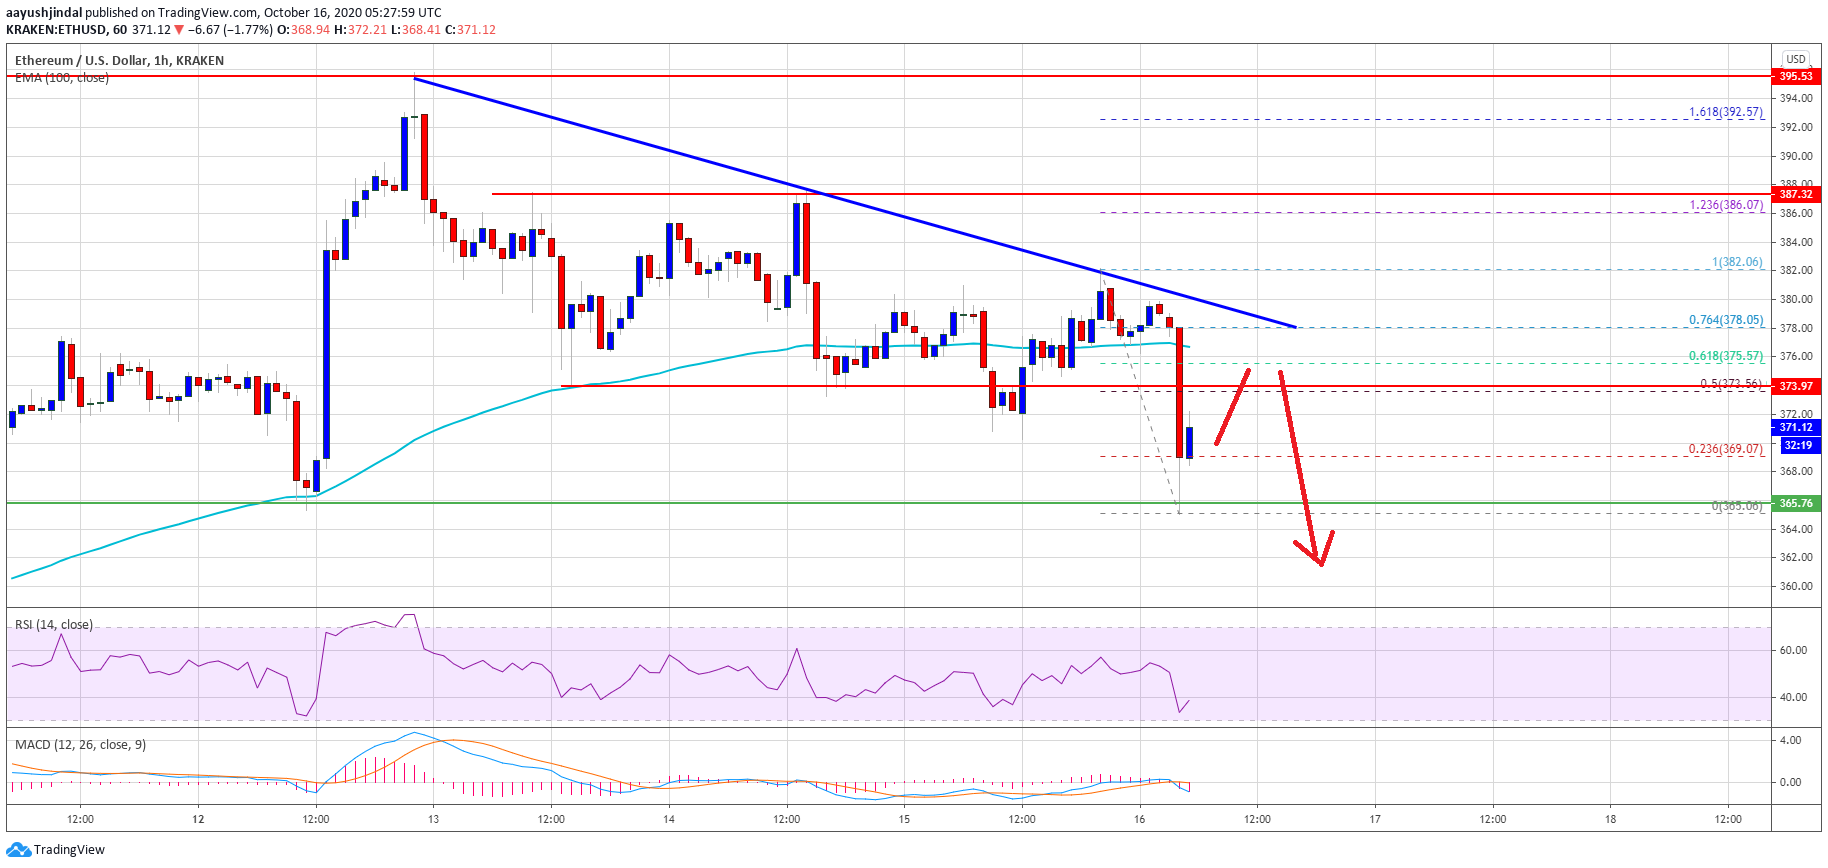
Ethereum faced a strong rejection above $380 against the US Dollar. ETH price is now at a risk of a sharp decline if it breaks the key $365 support in the near term.
- Ethereum struggled to gain momentum above the $380 and $382 levels.
- The price declined sharply below the 100 hourly simple moving average, and retested $365.
- There is a key bearish trend line forming with resistance near $378 on the hourly chart of ETH/USD (data feed via Kraken).
- The pair could decline heavily if there is a clear break below the $365 support level.
Ethereum Price Showing Bearish Signs
Ethereum started a steady decline from well above the $385 level. ETH price faced a strong resistance near the $380 and $382 levels, resulting in a drop below the $375 support.
Ether price even broke the $370 support and settled well below the 100 hourly simple moving average. It retested the key $365 support level and it is currently consolidating losses. An initial resistance is near the $372 level.
Source:The trend line is close to the 100 hourly simple moving average and the 76.4% Fib retracement level of the recent decline from the $382 high to $365 low. If there is no recovery above $374 and $378, there is a risk of a downside break below the $365 support.
Fresh Increase in ETH?
If Ethereum stays above the $365 support, it could start a fresh increase. The first key resistance is near the $374 level, but the main hurdle is now forming near $378. A clear break above the trend line resistance, $378, and the 100 hourly simple moving average could open the doors for a steady rise towards the $388 and $392 levels in the coming sessions.Hourly MACD – The MACD for ETH/USD is now gaining pace in the bearish zone.
Hourly RSI – The RSI for ETH/USD is now well below the 50 level.
Major Support Level – $365 Major Resistance Level – $374


