Ethereum struggled once again to clear the $1,640 resistance against the US Dollar. ETH is correcting lower and remains at a risk of a move below the $1,550 support.
- Ethereum is slowly moving lower below the $1,620 and $1,600 levels.
- The price is now trading below $1,600 and the 100 hourly simple moving average.
- There is a key contracting triangle forming with resistance near $1,590 on the hourly chart of ETH/USD (data feed via Kraken).
- The pair could start another decline if there is a clear move below the $1,550 support.
Ethereum Price Dips Again
Ethereum price started a decent increase above the $1,600 pivot level. ETH attempted a fresh upside break above the $1,640 resistance zone, but the bears protected more upsides.
A high was formed near $1,639 and the price started a downside correction. There was a move below the $1,600 level and the 100 hourly simple moving average. The price declined below the 50% Fib retracement level of the recent leg from the $1,518 swing low to $1,639 high.However, the bulls were active near the $1,550 support zone. The price stayed above the 61.8% Fib retracement level of the recent leg from the $1,518 swing low to $1,639 high.
Ether price is now trading below $1,600 and the 100 hourly simple moving average. An immediate resistance is near the $1,590 level. There is also a key contracting triangle forming with resistance near $1,590 on the hourly chart of ETH/USD.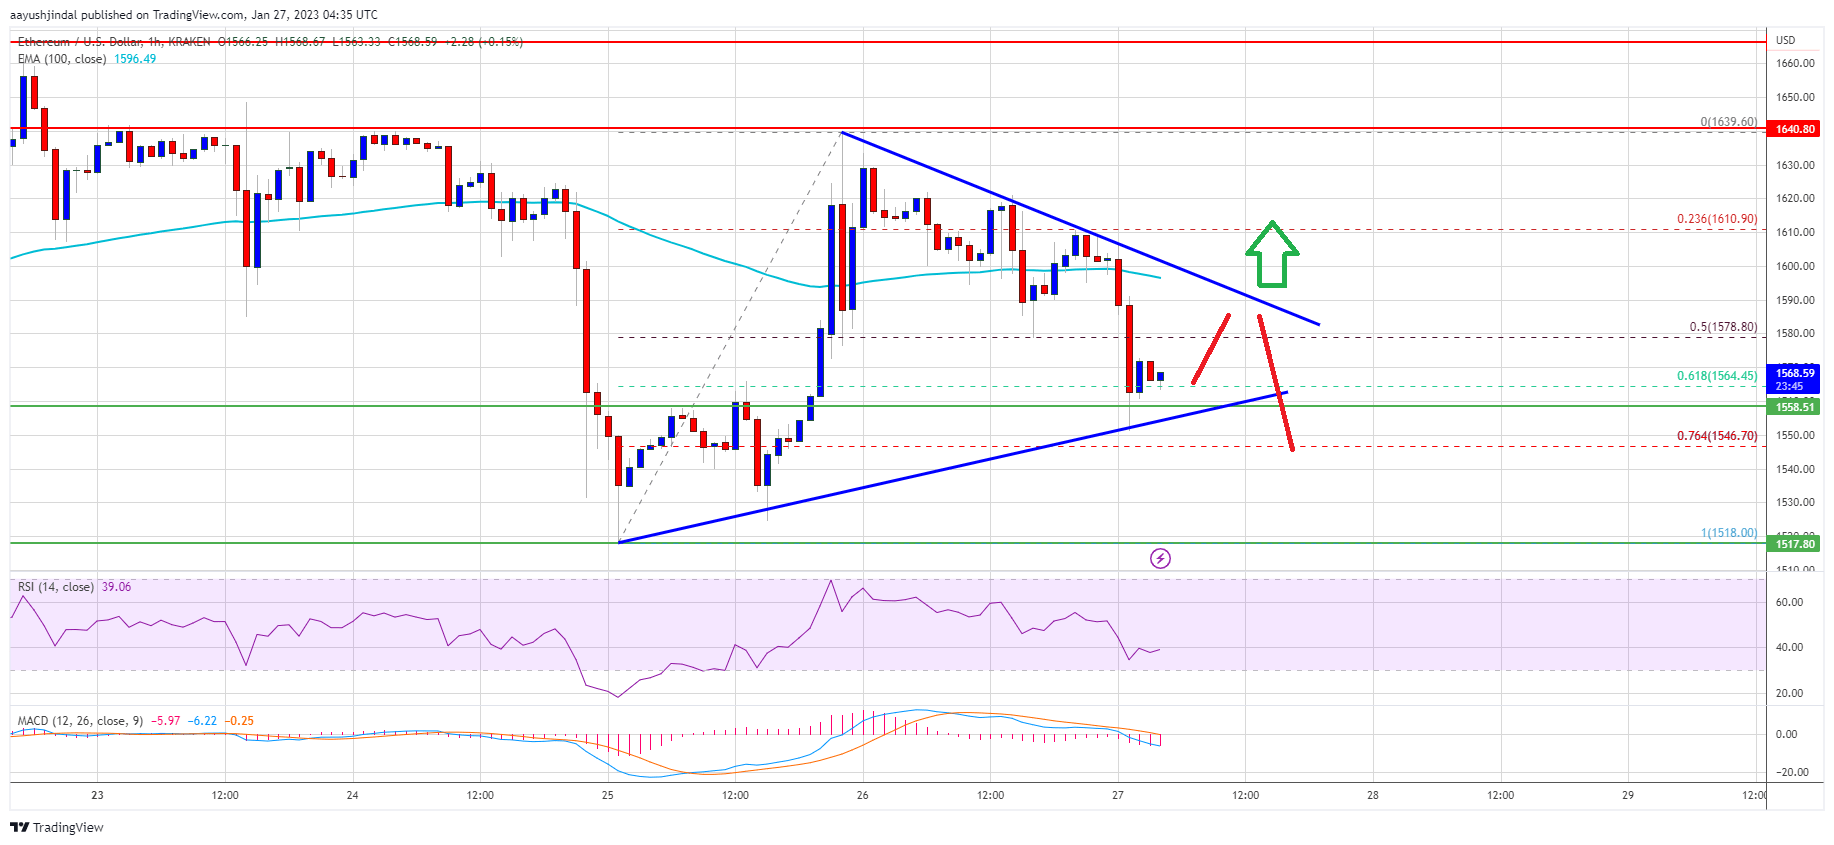
More Losses in ETH?
If ethereum fails to clear the $1,600 resistance, it could continue to move down. An initial support on the downside is near the $1,550 level or the triangle lower trend line.Hourly MACD – The MACD for ETH/USD is now gaining momentum in the bearish zone.
Hourly RSI – The RSI for ETH/USD is now below the 50 level.
Major Support Level – $1,550 Major Resistance Level – $1,600