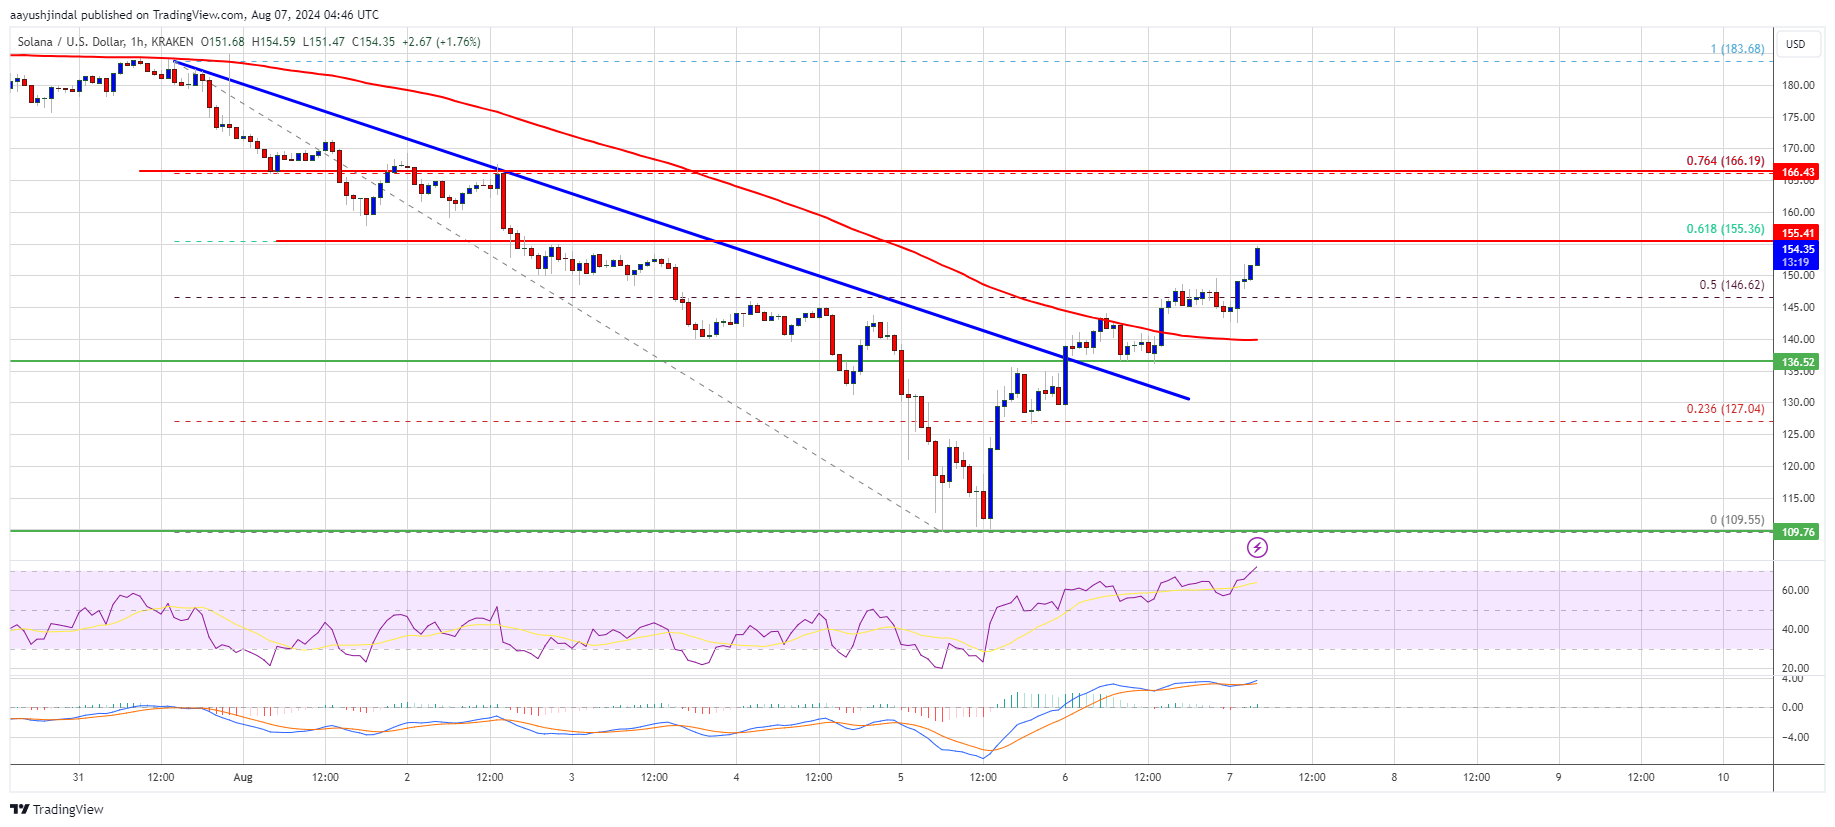
Solana started a decent upward move from the $110 zone. SOL price is rising and might increase further above the $155 resistance zone.
- SOL price started a recovery wave above the $135 and $140 levels against the US Dollar.
- The price is now trading above $145 and the 100-hourly simple moving average.
- There was a break above a key bearish trend line with resistance at $136 on the hourly chart of the SOL/USD pair (data source from Kraken).
- The pair could start another increase if it clears the $155 resistance zone.
Solana Price Recovers 15%
Solana price declined heavily below the $165 and $150 levels like Bitcoin and Ethereum. It even traded below the $120 support before the bulls appeared. A low was formed at $109 and SOL recently started a recovery wave.
There was a move above the $120 and $135 resistance levels. The price climbed above the 50% Fib retracement level of the downward move from the $184 swing high to the $109 low. Besides, there was a break above a key bearish trend line with resistance at $136 on the hourly chart of the SOL/USD pair. Solana is now trading above $145 and the 100-hourly simple moving average. On the upside, the price is facing resistance near the $155 level. It is close to the 61.8% Fib retracement level of the downward move from the $184 swing high to the $109 low.