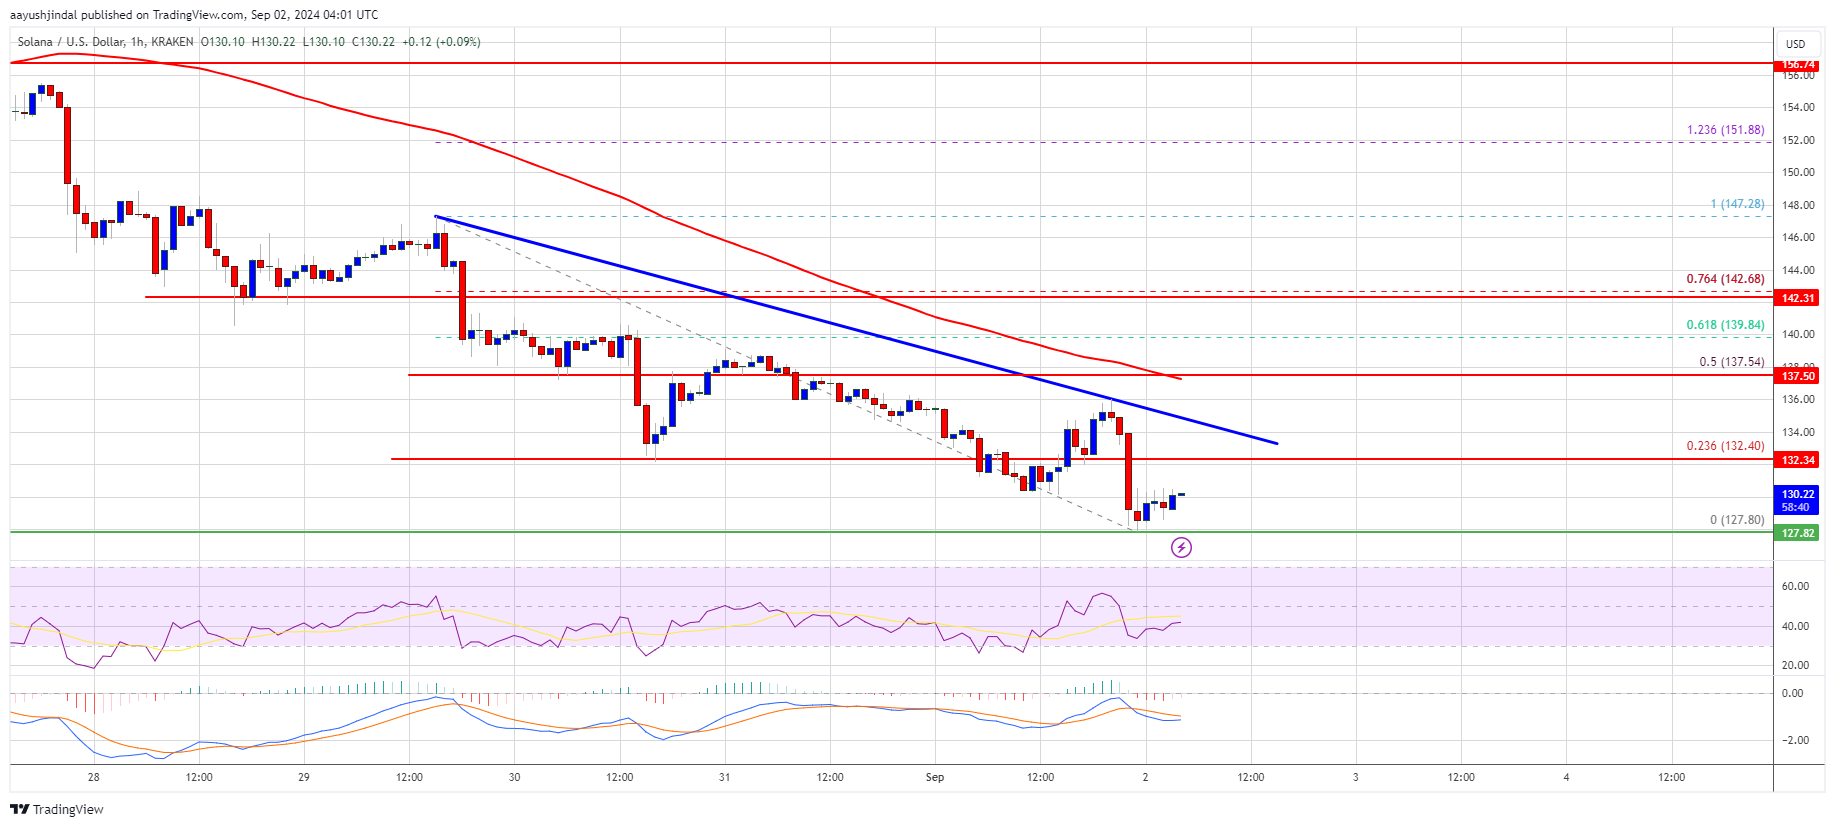
Solana started a fresh decline below $150 and $142. SOL price tested $128 and is currently struggling to start a recovery wave.
- SOL price started a fresh downward move below $150 against the US Dollar.
- The price is now trading below $140 and the 100-hourly simple moving average.
- There is a connecting bearish trend line forming with resistance at $134 on the hourly chart of the SOL/USD pair (data source from Kraken).
- The pair could start a recovery wave if it clears the $138 resistance zone.
Solana Price Extends Losses
Solana price started a fresh decline below the $150 support like Bitcoin and Ethereum. SOL gained pace and traded below the $142 level. It even tested the $128 support level.
A low was formed at $127.80 and the price is now consolidating losses. The price is showing some signs of a recovery wave, but it is still below the 23.6% Fib retracement level of the downward move from the $147.28 swing high to the $127.80 low. Solana is now trading well below $140 and the 100-hourly simple moving average. On the upside, the price is facing resistance near the $132.50 level. There is also a connecting bearish trend line forming with resistance at $134 on the hourly chart of the SOL/USD pair.