XRP price failed to climb above the $0.6050 resistance and declined. The price is now testing the $0.5765 support and might consolidate for some time.
- XRP price is still struggling to clear the $0.600 resistance zone.
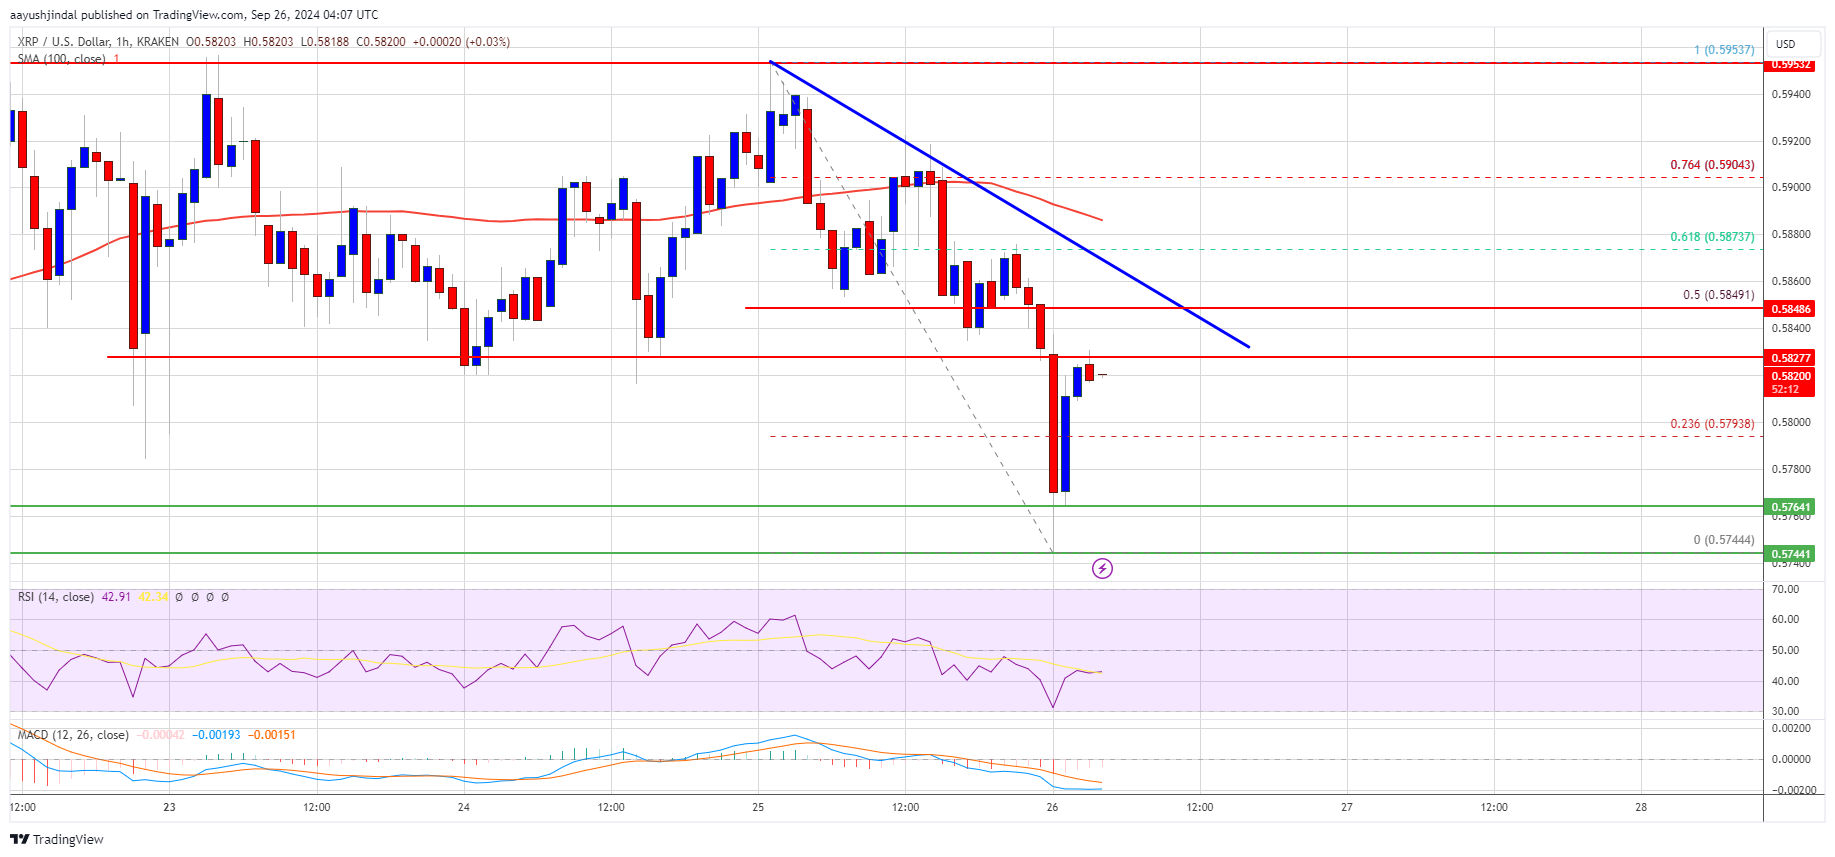
- The price is now trading below $0.590 and the 100-hourly Simple Moving Average.
- There is a key bearish trend line forming with resistance at $0.5850 on the hourly chart of the XRP/USD pair (data source from Kraken).
- The pair could start a fresh increase if it clears the $0.5850 and $0.5880 resistance levels.
XRP Price Dips Again
XRP price struggled to gain pace for a move above the $0.600 resistance zone. The price started a downside correction and traded below the $0.5880 support like Bitcoin and Ethereum.
There was a drop below the $0.580 level and the price tested $0.5750. A low was formed at $0.5744 and the price is now attempting a recovery wave. There was a move above the $0.5780 and $0.580 levels. The price cleared the 23.6% Fib retracement level of the downward move from the $0.5953 swing high to the $0.5744 low. The price is now trading below $0.590 and the 100-hourly Simple Moving Average. On the upside, the price might face resistance near the $0.5850 level. There is also a key bearish trend line forming with resistance at $0.5850 on the hourly chart of the XRP/USD pair.