Bitcoin price extended its increase above $50,000 before correcting lower against the US Dollar. BTC could find bids near $48,250 and it might start a fresh rally.
- Bitcoin started a fresh increase above the $49,500 and $50,000 resistance levels.
- The price is now trading above $48,500 and the 100 hourly simple moving average.
- There was a break below a key bullish trend line with support near $49,000 on the hourly chart of the BTC/USD pair (data feed from Kraken).
- The pair could start a fresh increase as long as it is above the $48,000 support zone.
Bitcoin Price Dips From $50K
Bitcoin price extended its increase above the $49,000 resistance zone. BTC even surpassed the $50,000 resistance zone, but it failed to continue higher.
A high was formed near $50,364 before the price started a downside correction. There was a break below the $50,000 and $49,000 levels. Besides, there was a break below a key bullish trend line with support near $49,000 on the hourly chart of the BTC/USD pair.The pair tested the 50% Fib retracement level of the upward move from the $46,640 swing low to $50,364 high. Bitcoin is also trading above $48,500 and the 100 hourly simple moving average.
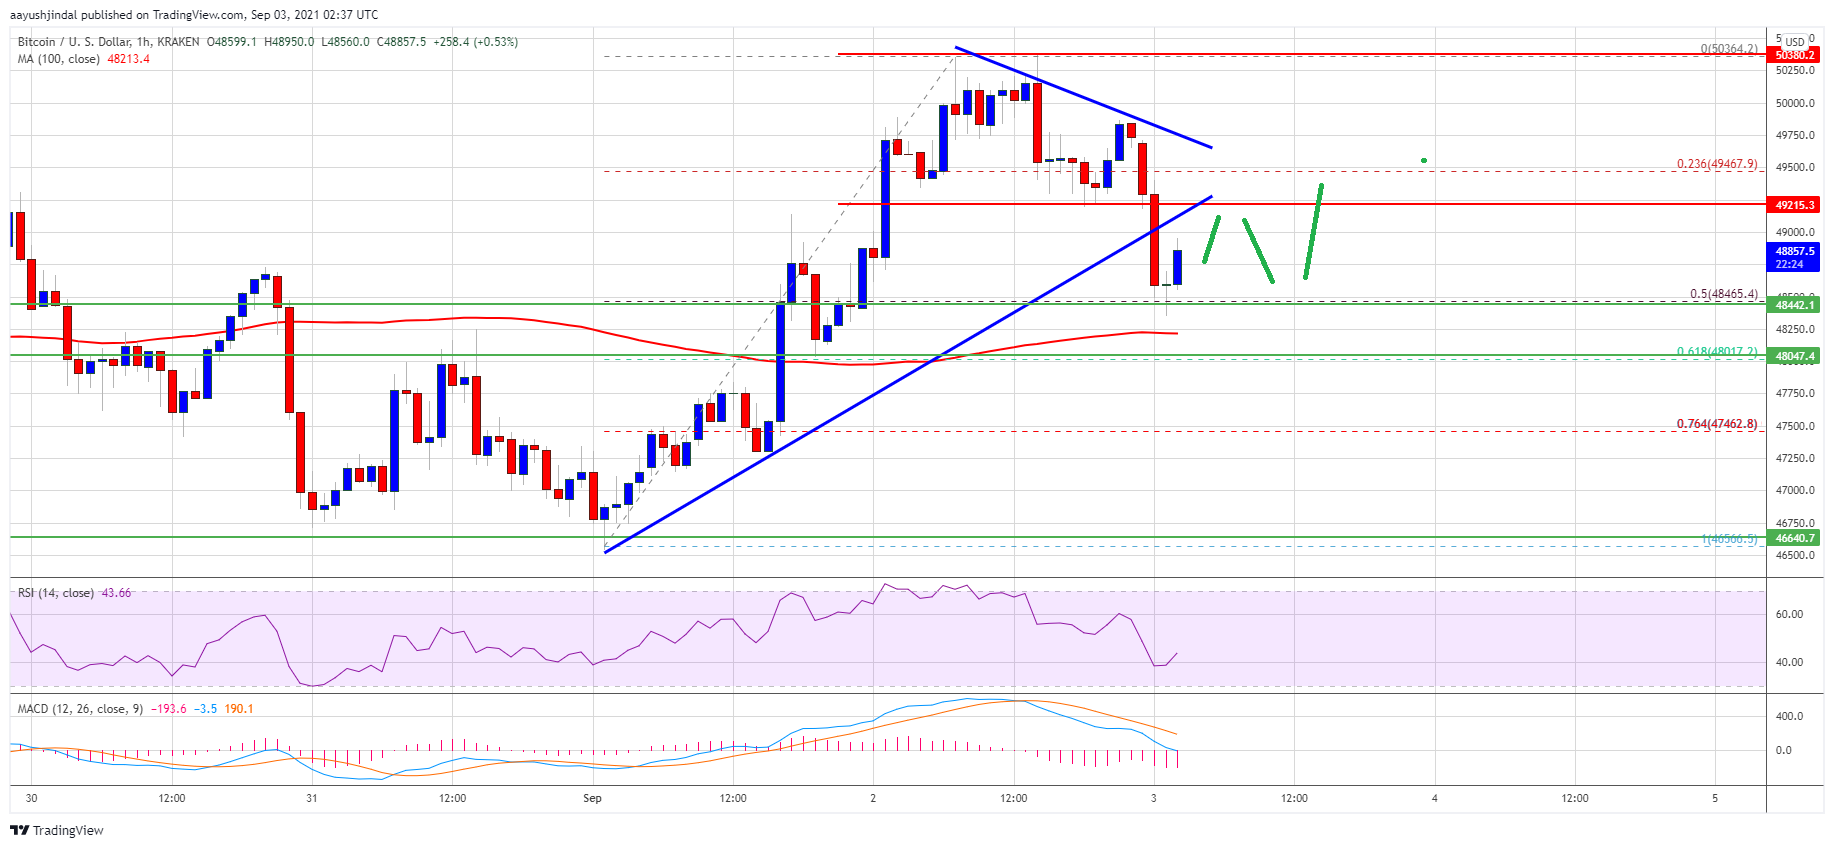
Source:The next key support is near the $48,250 level and $48,000. It is close to the 61.8% Fib retracement level of the upward move from the $46,640 swing low to $50,364 high. If there is a downside break below the $48,000 support zone and the 100 hourly SMA, the price might start a fresh decline. The next major support is near the $46,500 level.