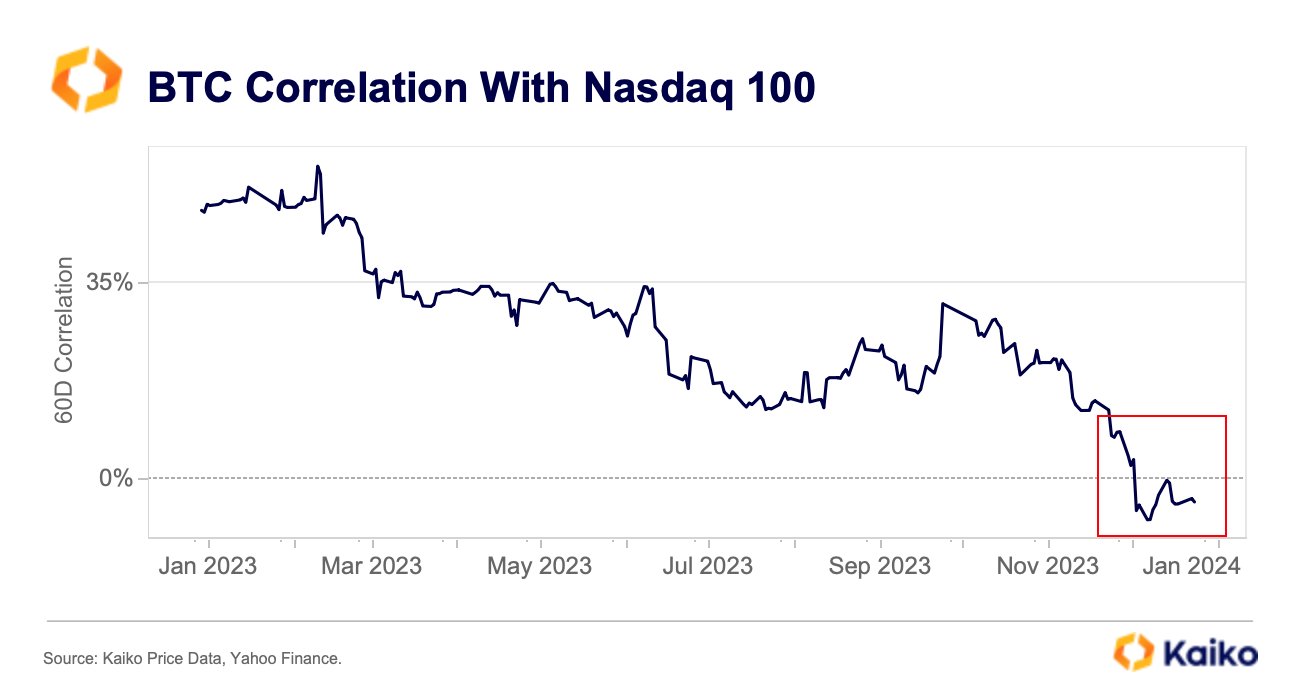
Bitcoin 60-Day Correlation To Nasdaq 100 Is Negative Right Now
In a new on X, the analytics firm has discussed what the trend in the correlation between BTC and Nasdaq has looked like recently. The “correlation” here refers to a metric that keeps track of how tied together the prices of two commodities have been over a given period.
This period can naturally be of any length, but in the context of the current topic, the 60-day correlation is of interest. This indicator version measures the prices’ dependence on each other during the past two months. When the value of this metric is greater than zero, it means that the price of one asset has been reacting to the other by moving in the same direction. The closer the indicator is to one, the stronger this relationship. On the other hand, values under zero suggest some correlation between the two assets, but it has been a negative one. This means that the assets have reacted to each other by moving in the opposite direction. In this case, the extreme point is -1, so the closer the indicator is to this mark, the stronger the correlation between the prices. Lastly, the correlation being exactly zero implies that there is no correlation whatsoever between the two assets. In mathematics, such a condition occurs when two variables are independent. Now, here is a chart that shows the trend in the 60-day correlation between Bitcoin and Nasdaq 100 over the past year:The value of the metric appears to have taken a plunge in recent weeks | Source:As the above graph shows, the 60-day correlation between Bitcoin and Nasdaq is shown in percentage here, with 100% corresponding to a value of 1. From the chart, it’s apparent that the metric’s value was in a state of overall gradual decline during 2023, up until the final couple of months of the year, when the metric took an especially sharp dive. Some amount of positive correlation had existed between the two assets before this plummet, but following it, the 60-day correlation took to negative values. However, the indicator remained close to the 0% mark, implying that the two only had a slight negative relationship. The correlation had started surging and reached almost exactly 0% for a brief period just earlier, but the metric has since again come down and assumed slight negative values.
It would appear that BTC has kicked off 2024 slightly, moving against the traditional markets, which could set the stage for the cryptocurrency to go on and explore its territories this year.
BTC Price
At the time of writing, Bitcoin is trading around the $44,800 mark, up over 5% over the past week.Looks like the price of the coin has shot up over the past day | Source:
Featured image from Shutterstock.com, charts from TradingView.com, Kaiko.com

