Why Bitcoin Bulls Could Be Ready To Stampede
Bitcoin might be an asset unlike any other, but it is measured using the same price and time axis on charting software, using candlesticks, bar charts, and other chart styles. The use of Japanese candlesticks provides information on each session’s open, high, low, and close.
BTCUSD Monthly: A Tale Of Three Bullish Candlestick Patterns
Bitcoin price 1-month charts didn’t just close with one powerful Japanese candlestick-based signal, but three.
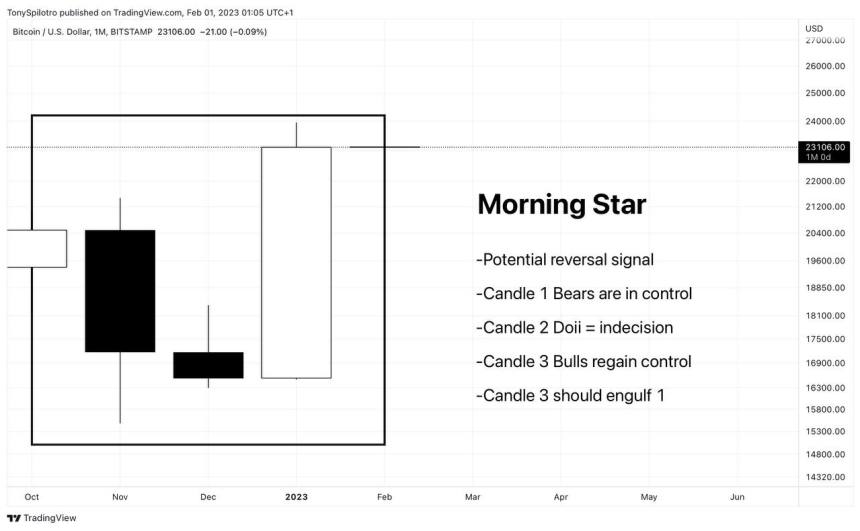
Morning Star
The first is a three-candle pattern called a morning star. The morning star pattern is a potential reversal pattern, consisting of a large black candle down, a doji showing a pause and moment of indecision, and a large white candle that engulfs at least 50% of the black down candle. The more the white candle engulfs the black candle, the stronger the signal. 
Bitcoin monthly formed a morning star pattern |
The morning star in BTCUSD didn’t just engulf the black candle, it complete erased it and then some. Notably, the rally was able to wipe out the downside created by the FTX collapse – a bullish signal in its own right. The morning star tells a story that bears were in control, but selling became exhausted and bulls easily took charge. A confirmed morning star reversal can lead to up to three to five sessions of upside, or roughly three to five months given the timeframe.
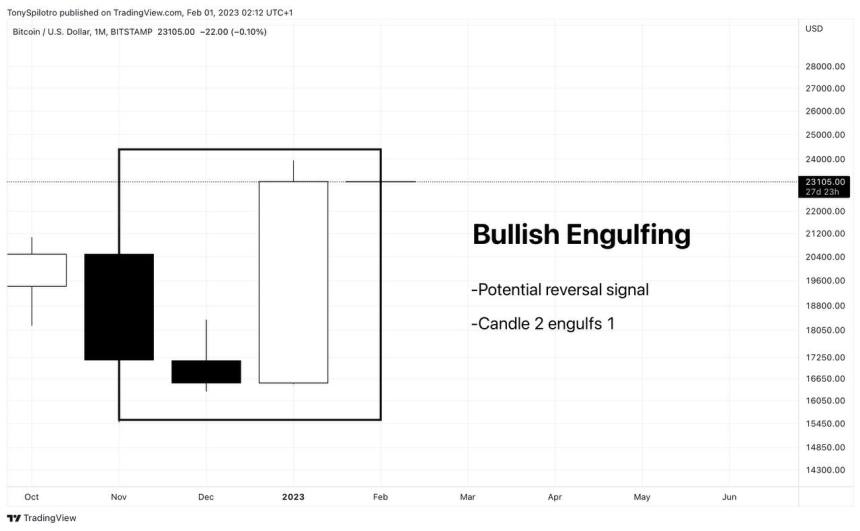
Bullish Engulfing
The second signal was a bullish engulfing. As the least complex or exciting of the three signals, it still is commonly a reversal signal in the study of Japanese candlesticks.

A bullish engulfing also formed on monthly timeframes |In this scenario, the second white candle must fully engulf the prior black candle. Since the candle was a black doji, bulls had no trouble bursting out of the tight range. Bullish engulfing aren’t as powerful as the other signals, either, but when combined with the rest of the patterns only adds momentum at bulls’ backs.
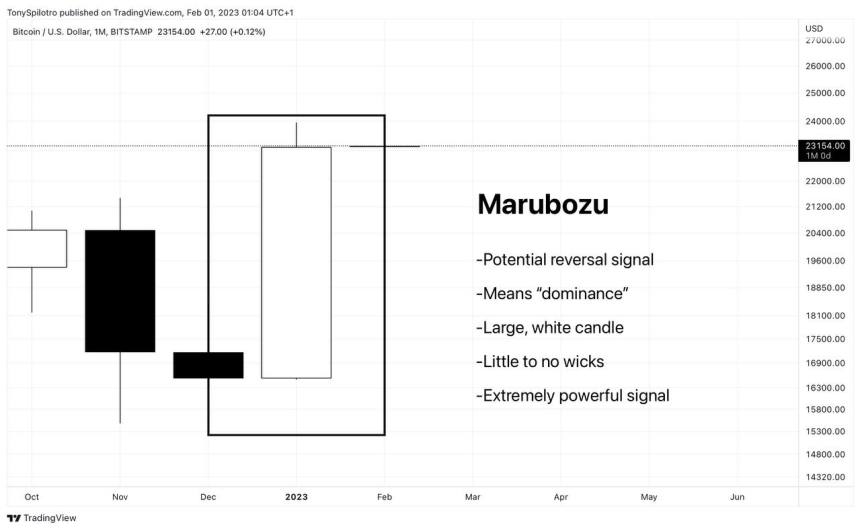
Marubozu

The one-month closed as a Marubozu "open" |The BTCUSD monthly closed with a rare and powerful bullish signal called a Marubozu open. This type of candle is extremely powerful and shows utter dominance by buyers. In a downtrend, it can be a reversal signal, or in an uptrend it shows increasing aggression from buyers and a strengthening trend.

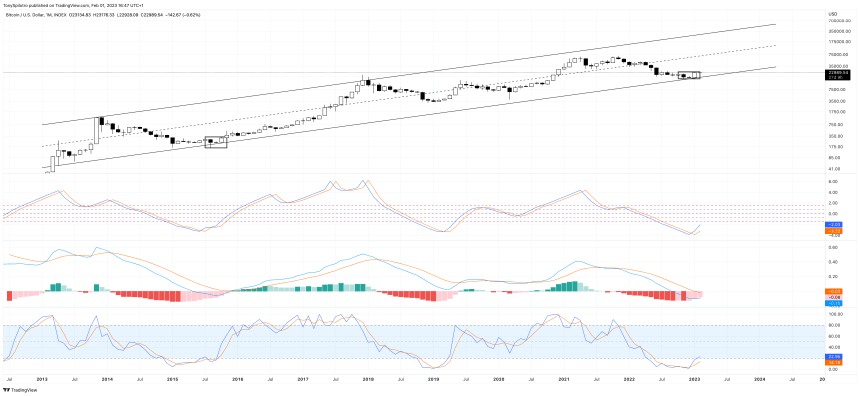
Technicals could provide enough confluence of bullish signals |
Signals from Japanese candlestick patterns require added confirmation from technical indicators or chart patterns and trend lines. Technical indicators such as the Stochastic and MACD, and statistical tools like the Fisher Transform each suggest a potential reversal according to historical performance on the 1M timeframe.
For these signals to be valid, bulls must follow through over the next several months. Failure of several bullish signals would otherwise be devastating for the chances of a new uptrend. Time will tell if these early Japanese candlestick signals fully confirm.


