

Bitcoin price broke the key $52,000 resistance zone against the US Dollar. BTC remains supported and it could continue to climb higher towards $55,000.
- Bitcoin started a fresh increase above the $51,500 and $52,000 resistance levels.
- The price is now trading above $52,000 and the 100 hourly simple moving average.
- There is a key bullish trend line forming with support near $52,250 on the hourly chart of the BTC/USD pair (data feed from Kraken).
- The pair could dips a few points, but it might find support near $52,250 and $52,000.
Bitcoin Price Extends Gains
Bitcoin price consolidated above the $51,000 zone for some time before starting a fresh increase. BTC broke the key $52,000 resistance zone and the 100 hourly simple moving average to move further into a positive zone.
The price even broke the $52,500 resistance and traded as high as $52,800. It is now trading well above $52,000 and the 100 hourly simple moving average. An immediate support is near the $52,400 level. It is near the 23.6% Fib retracement level of the recent increase from the $51,183 swing low to $52,800 high.
The next support could be near the $52,250 level. There is also a key bullish trend line forming with support near $52,250 on the hourly chart of the BTC/USD pair.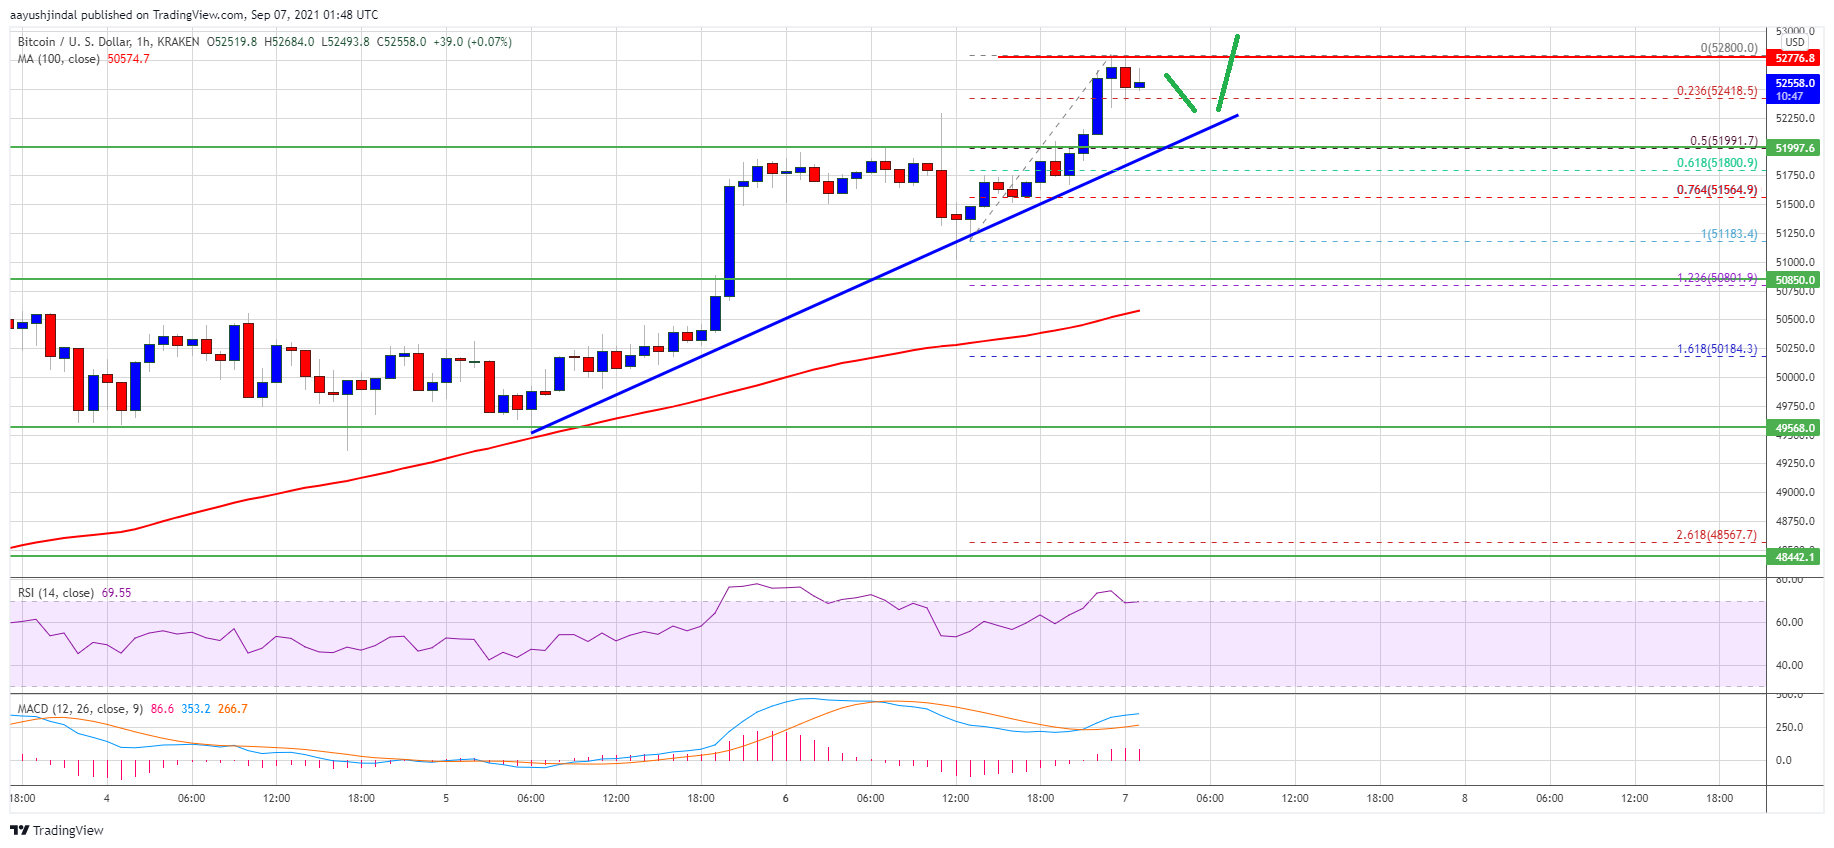
Source:The main support is now forming near the $52,000 level. It is close to the 50% Fib retracement level of the recent increase from the $51,183 swing low to $52,800 high. If there is a downside break below the $52,000 support zone, the price could extend its decline. In the stated case, the price could test the $50,850 support or the 100 hourly SMA.