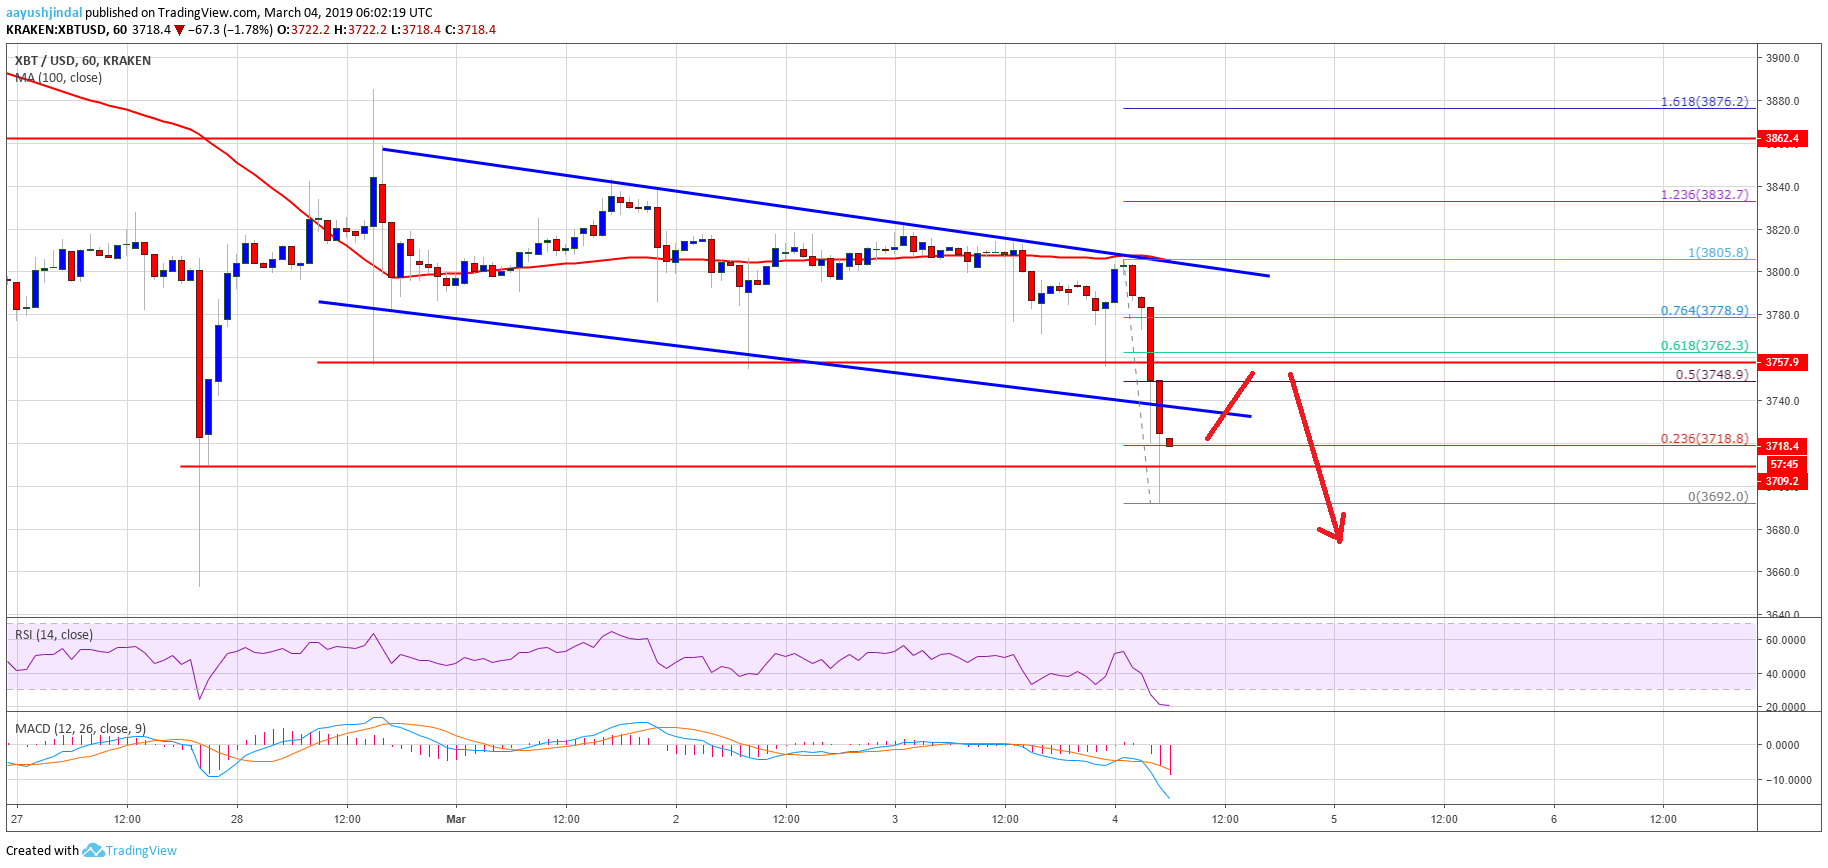
- Bitcoin price failed on many occasions to break the key $3,860 resistance level against the US Dollar.
- The price started a downward move and broke the $3,800 and $3,760 support levels.
- There was a break below a declining channel with resistance at $3,800 on the hourly chart of the BTC/USD pair (data feed from Kraken).
- The pair is trading in a bearish zone and it could decline further below $3,700 and $3,680.
Bitcoin price failed to climb above key resistances and declined against the US Dollar. BTC is likely to retest the key $3,600 support area before it could bounce back above $3,800.
Bitcoin Price Analysis
This past week, we saw many rejections near the $3,900 and $3,860 resistances in bitcoin price against the US Dollar. The BTC/USD pair topped near the $3,860 level and later started a downward move. It broke the $3,800 and $3,760 support levels to move into a bearish zone. The recent decline was crucial as the price settled below the $3,800 level and the 100 hourly simple moving average. The decline was such that the price even broke the $3,720 support level.
Moreover, there was a break below a declining channel with resistance at $3,800 on the hourly chart of the BTC/USD pair. Finally, a new intraday low was formed near $3,692. In the short term, there could be a minor upside correction towards $3,760 or $3,750. The 50% Fib retracement level of the recent decline from the $3,805 high to $3,692 low is near the $3,748 level to act as a resistance. However, the main resistance is near the $3,800 level and the channel upper trend line.


