Relative Strength Index And The Bullish Take On Bitcoin
The Relative Strength Index is yet another tool developed by J. Welles Wilder Jr. Another tool this “father” of technical analysis created was heavily discussed recently – the Average Directional Index. The engineer is also responsible for the Parabolic SAR and Average True Range.
Related Reading | Building The Case For A Potential Bitcoin False Bottom
Price action can also diverge away from following the same movements of the RSI gauge, which could be a signal of a weakening trend.

Breaking up from these patterns could resume the uptrend | Source:
The RSI can also react to support and resistance or follow along trend lines just like price action, and the recent sideways trend has resulted in two tightening trend lines on the tool that are about to pop one way or the other.
A bullish falling wedge pattern points to a retest of $50,000, but because technical analysis is a constantly developing study, there’s a chance the pattern isn’t as bullish as it appears to be.
The Unbiased Bearish Take That Suggests A Fall To Former ATH
For every bullish pattern, there’s a bearish pattern lying in the wait. The last time the market was convinced there was a bullish pattern ready to send Bitcoin higher, it was a bearish rising wedge pattern in disguise. This pattern was the local top, and send the crypto market crashing by more than 50%.
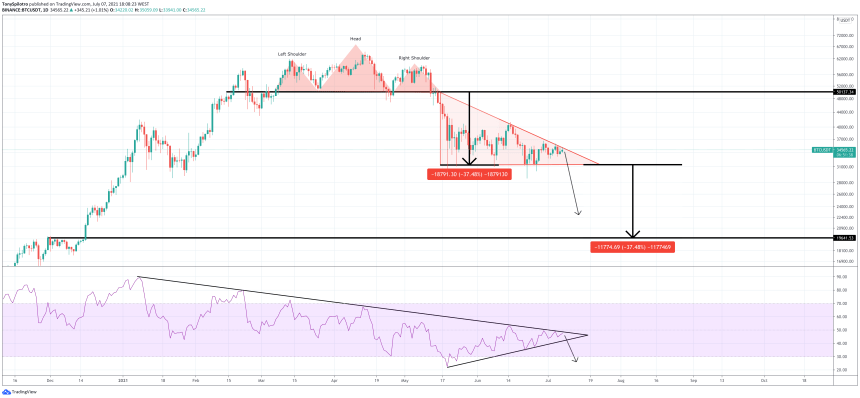
The sideways price action has resulted in several higher lows, yet the same lows again and again. If this price action sounds familiar, that’s because it is the description of a descending triangle, which has in the past has been the most dangerous pattern crypto.

Things could get nasty if the RSI breaks down instead | Source:The RSI trend line is symmetrical and could break bullish or bearish, and if the triangle formed breaks down instead, it could cause the price pattern to confirm and follow.
Related Reading | The Missing Ingredient From A Full On Bitcoin Reversal
Based on the measure rule, the target of the descending triangle would be almost exactly the former all-time high of Bitcoin. Which direction will the top cryptocurrency ultimately break?Follow or via . Content is educational and should not be considered investment advice.
Featured image from iStockPhoto, Charts from TradingView.com


