

Bitcoin price declined over 15% and tested $42,000 against the US Dollar. BTC is recovering, but it could face sellers near the $48,500 and $49,000 resistance levels.
- Bitcoin started a major decline below the $50,000 and $48,500 support levels.
- The price is now trading well below $50,000 and the 100 hourly simple moving average.
- There was a break below a key bullish trend line with support near $52,150 on the hourly chart of the BTC/USD pair (data feed from Kraken).
- The pair is correcting losses, but the bears are likely to remain active near $48,500 and $50,000.
Bitcoin Price Recovers Above $45K
Bitcoin price failed to clear the $53,000 zone and started a major decline. BTC broke the key $52,000 support zone and the 100 hourly simple moving average to into a bearish zone.
There was also a break below a key bullish trend line with support near $52,150 on the hourly chart of the BTC/USD pair. The pair even declined heavily below the $48,500 support zone. Finally, there was a spike below the $45,000 support zone and the price tested the $42,000 level.
A low was formed near $42,000 before there was a recovery wave. The price climbed above the $45,000 resistance. It broke the 23.6% Fib retracement level of the recent decline from the $52,800 swing high to $42,000 swing low.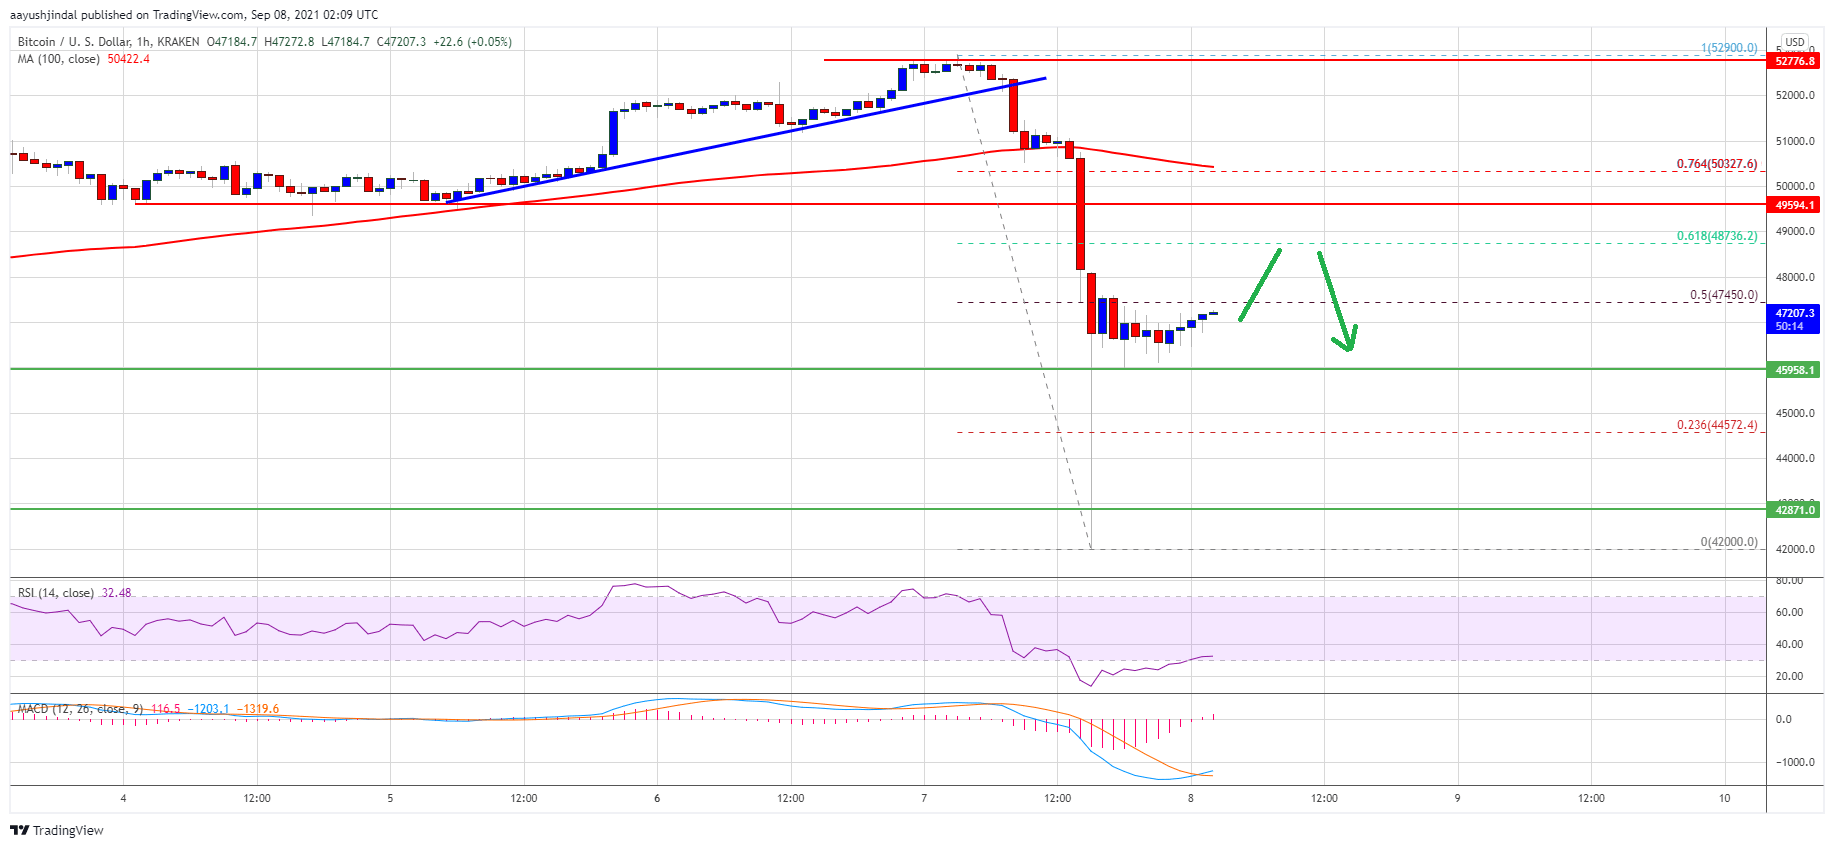
Source:An immediate resistance on the upside is near the $47,500 level. It is near the 50% Fib retracement level of the recent decline from the $52,800 swing high to $42,000 swing low. The first major resistance is near the $48,500 level. A close above the $48,500 level could pump the price in the near term. The next major hurdle for the bulls could be near the $50,000 zone.