Crypto Fear And Greed Index Shows Investors Are Fearful Right Now
According to the latest weekly report from , the crypto market sentiment has remained stable in deep fear territory during the past week.The “fear and greed index” is an indicator that tells us about the general sentiment among investors in the crypto market.
The metric uses a numeric scale that moves from zero to hundred for representing this sentiment. All values on the upper side of 50 indicate a greedy market, while those below the mark imply investors are fearful.Values of the indicator towards the end of the range signify sentiments of “extreme greed” (more than 75) and “extreme fear” (less than 25).
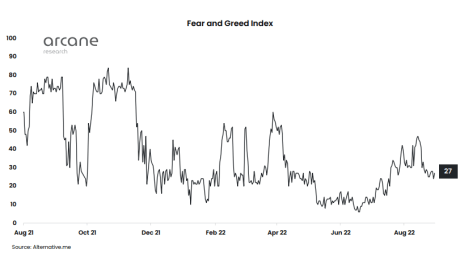
Now, here is a chart that shows the trend in the crypto fear and greed index over the past year:
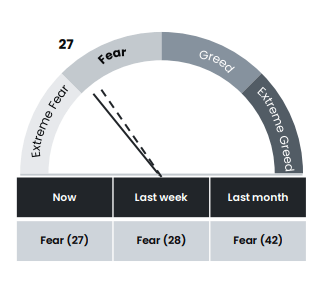
The value of the metric seems to have come down in recent days | Source:As you can see in the above graph, the crypto fear and greed index had been climbing up for a few weeks and almost entered into the greed territory as prices of coins like Bitcoin rallied up. However, with the end of the rally, the market sentiment immediately plummeted back down into the depths of fear, showing the investor mentality was quite weak to begin with. The current value of the indicator is just 27, which is only two points away from the extreme fear territory. This is a slight decline over the last seven days as the metric had a value of 28 then.

Looks like the value of the indicator was 42 last month | Source:Nonetheless, the report points out that at the same low $20k levels of the Bitcoin price as now, the market sentiment was much worse back in June as it was firmly inside extreme fear. This implies that investors are now more comfortable at these price levels than compared to a couple of months back.
BTC Price
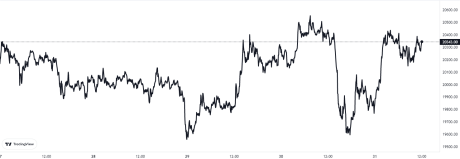
At the time of writing, Bitcoin’s price floats around $20.3k, down 5% in the last week. Over the past month, the crypto has lost 14% in value.
The below chart shows the trend in the price of the coin over the last five days.
The value of the crypto has been mostly moving sideways during the past few days | Source:
Featured image from Peio Bty on Unsplash.com, charts from TradingView.com, Arcane Research
