Polkadot (DOT) is showing bearish signs below the $8 resistance against the US Dollar. The price could extend its decline if it fails to stay above $6.00.
- DOT is gaining pace below the $8.80 and $8.00 levels against the US Dollar.
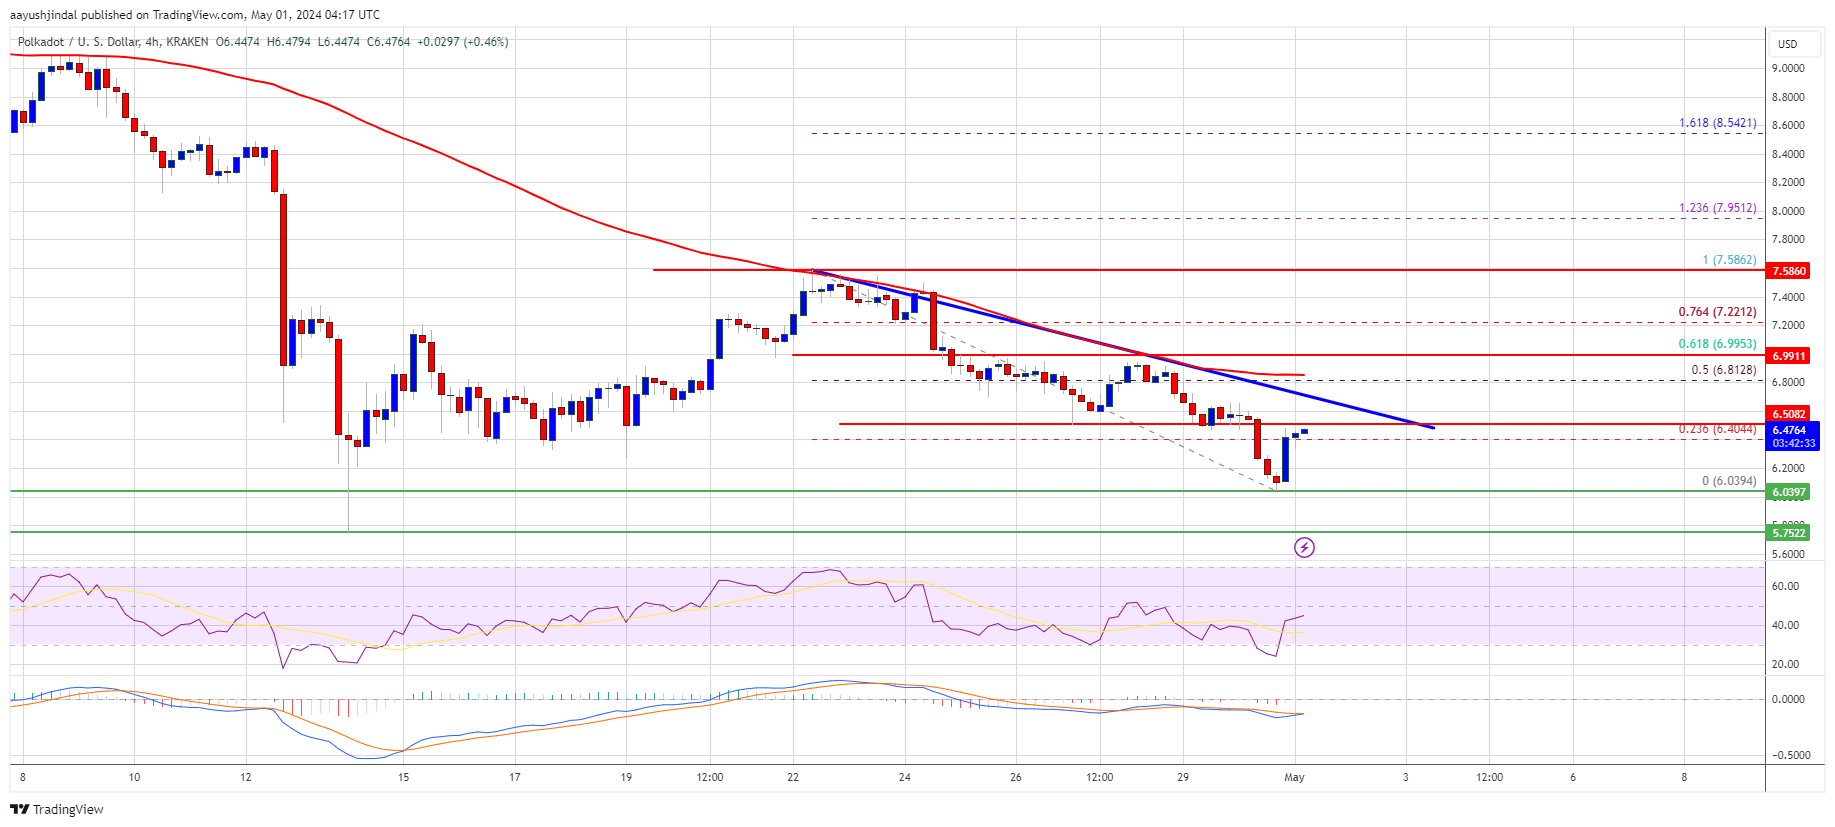
- The price is trading below the $7.20 zone and the 100 simple moving average (4 hours).
- There is a key bearish trend line forming with resistance at $6.50 on the 4-hour chart of the DOT/USD pair (data source from Kraken).
- The pair could continue to decline toward the $5.00 support zone.
Polkadot Price Resumes Drop
After a steady increase, DOT price faced resistance near the $7.60 zone. It formed a short-term top and started a fresh decline below the $7.00 level, like Ethereum and Bitcoin.
There was a move below the $6.20 support zone. A low was formed near $6.03 and the price is now consolidating losses. It is slowly moving higher above the $6.35 level and the 23.6% Fib retracement level of the downward move from the $7.58 swing high to the $6.03 low. DOT is now trading below the $7.00 zone and the 100 simple moving average (4 hours). Immediate resistance is near the $6.50 level. There is also a key bearish trend line forming with resistance at $6.50 on the 4-hour chart of the DOT/USD pair.