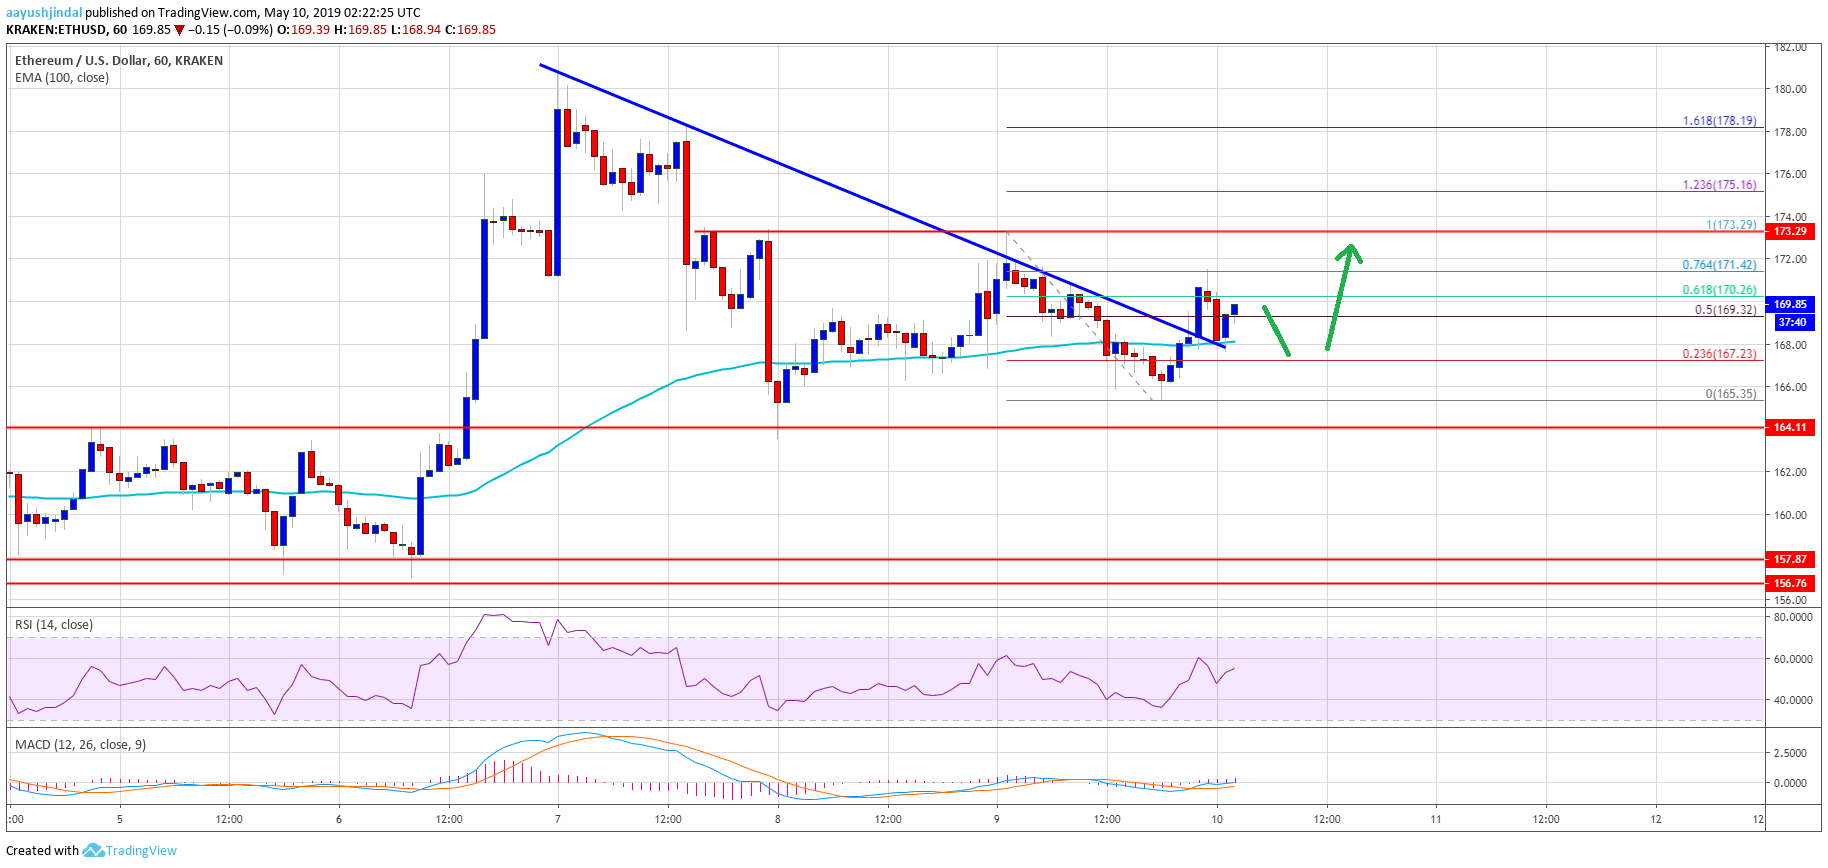
- ETH price remains supported above the $164 level and recently recovered against the US Dollar.
- The price is still struggling to clear the $172 and $173 resistance levels, despite gains in bitcoin.
- There was a break above a key bearish trend line with resistance at $168 on the hourly chart of ETH/USD (data feed via Kraken).
- The pair could trade in a range before it makes an attempt to break the $172 and $175 resistance levels.
Ethereum price is trading sideways with positive signs versus the US Dollar, but declined further vs bitcoin. ETH remains supported above $164 and it might soon climb above $172 and $175.
Ethereum Price Analysis
In the past three sessions, there were mostly range moves in Ethereum price above $164 against the US Dollar. The ETH/USD pair slowly moved higher and broke the $168 resistance and the 100 hourly simple moving average. There was also a break above the $170 level, but the price struggled near $173 plus the 50% Fib retracement level of the downside move from the $180 high to $164 low. The price retreated from the $173 swing high and revisited the $165 support area.
Recently, it bounced back above $168 and the 100 hourly SMA. Moreover, there was a break above a key bearish trend line with resistance at $168 on the hourly chart of ETH/USD. The pair traded above the 61.8% Fib retracement level of the recent slide from the $173 high to $165 low. However, the bulls seem to be struggling to gain bullish momentum above $172 and $173. ETH price is currently trading in a range and it could even dip a few points towards the $167 or $165 support.
ETH Technical Indicators
Hourly MACD – The MACD for ETH/USD is mostly flat in the bullish zone.
Hourly RSI – The RSI for ETH/USD moved above the 50 level and it is currently near the 54 level.
Major Support Level – $165


