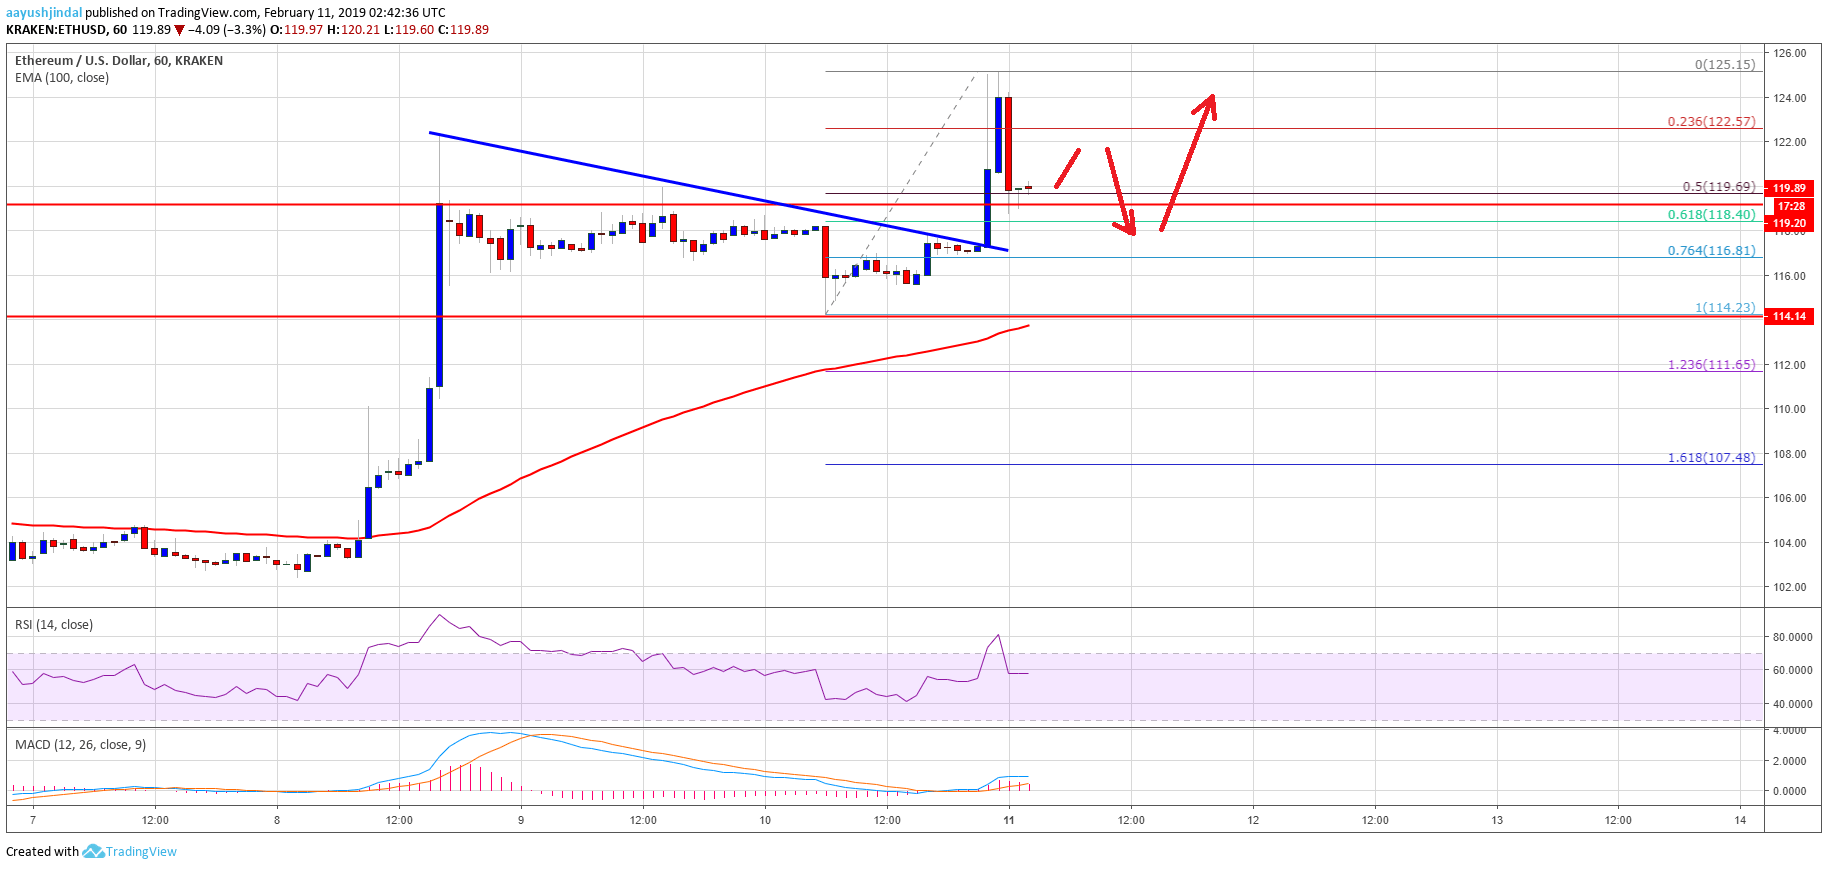
- ETH price extended gains and traded above the $118 and $120 resistance levels against the US Dollar.
- There was a break above a major bearish trend line with resistance near $117 on the hourly chart of ETH/USD (data feed via Kraken).
- The pair traded towards the $125 resistance and later corrected lower towards $120.
Ethereum price is placed nicely in an uptrend against the US Dollar and bitcoin. ETH/USD could correct a few points, but dips remain attractive in the near term near $116.
Ethereum Price Analysis
In the weekly analysis, we discussed the chances of more gains above $120 in ETH price against the US Dollar. The ETH/USD pair corrected a few points, found support near the $115 level, and finally bounced back. It gained pace above the $116 and $118 resistance levels. Buyers were successful in clearing the key $120 resistance to set the pace for a new monthly high. More importantly, the price stayed well above the $114 support and the 100 hourly simple moving average.
During the rise, there was a break above a major bearish trend line with resistance near $117 on the hourly chart of ETH/USD. The pair broke the $122 swing high and traded to a new monthly high at $125. Later, there was a sharp downside correction below the $122 level. The price traded below the 50% Fib retracement level of the last wave from the $114 low to $125 high. However, the previous resistance near the $120 level acted as a support. Besides, the 61.8% Fib retracement level of the last wave from the $114 low to $125 high prevented losses. At the outset, the price is slightly bearish and it could correct further towards the $116 level.

ETH Technical Indicators
Hourly MACD – The MACD for ETH/USD is placed nicely in the bullish zone.
Hourly RSI – The RSI for ETH/USD is currently just below the 60 level, with a flat structure.
Major Support Level – $116 Major Resistance Level – $125


