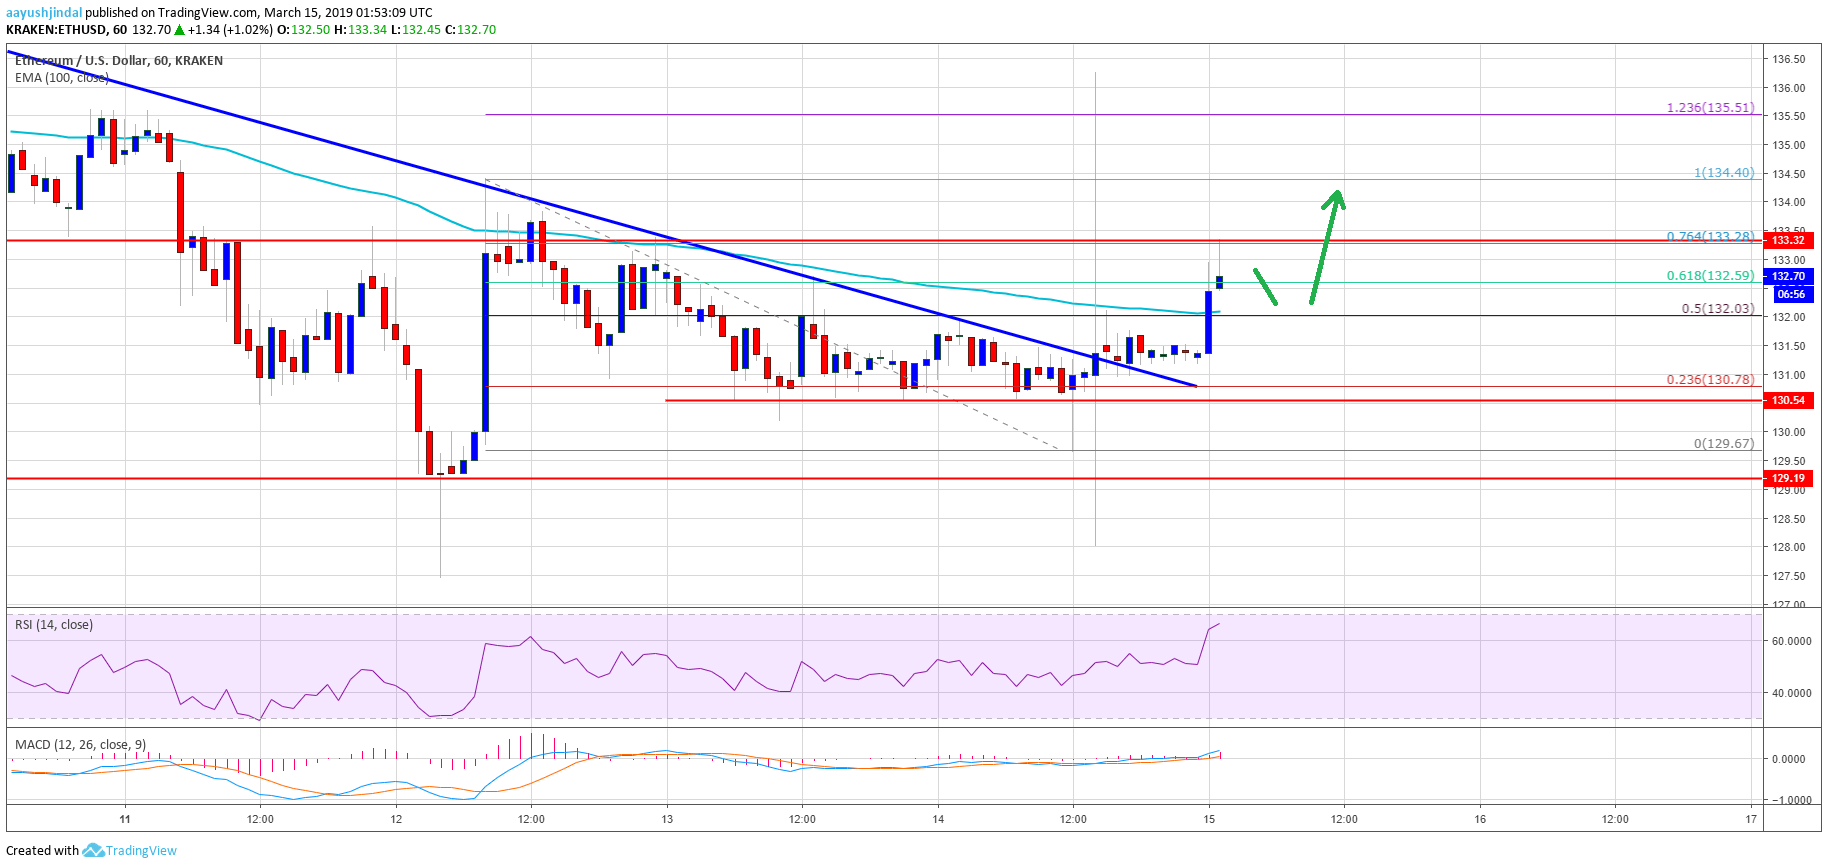
- ETH price managed to stay above the $130 support level and recovered above $132 against the US Dollar.
- There were swing moves near $130 before the price settled above the $132 pivot level.
- This week’s important bearish trend line was breached with resistance at $131 on the hourly chart of ETH/USD (data feed via Kraken).
- The pair is now facing a solid resistance near the $134 level and it could extend gains in the near term.
Ethereum price spiked a few times higher against the US Dollar and bitcoin. ETH formed a solid support near $130 and it may climb higher above the $134 and $135 resistance levels.
Ethereum Price Analysis
Yesterday, we saw a few swing moves near the $130 level in ETH price against the US Dollar. The ETH/USD pair spiked sharply below the $130 and $129 levels and later recovered above the $130 level. Later, there were consolidation moves before the price climbed above the $131 and $132 resistance levels. More importantly, there was a close above the $132 resistance and the 100 hourly simple moving average.
During the upside, this week’s important bearish trend line was breached with resistance at $131 on the hourly chart of ETH/USD. The pair broke the 50% Fib retracement level of the last slide $135 swing high to $129 swing low. It opened the doors for more gains above the $132 level. There was also a spike above the $133 level, but upsides were capped by the key $134 resistance. The price also faced sellers near the 76.4% Fib retracement level of the last slide $135 swing high to $129 swing low. It is currently consolidating above the $132 support and the 100 hourly SMA.
On the upside, the price needs to clear the $134 resistance to continue higher. The next main resistance is near the last swing high at $135. Once the price clears both hurdles, it is likely to test the $140 resistance. On the other hand, if there is a downside correction, the $132 level might provide support. Any further losses might push it back towards the $130 support.

Looking at the , ETH price clearly made a few nasty moves, but it managed to settle above $132, which is a positive sign. As long as it stays above the $132 support and the 100 hourly SMA, it remains supported for more upsides towards the $135, $137 and $140 levels.
ETH Technical Indicators
Hourly MACD – The MACD for ETH/USD is gaining pace in the bullish zone.
Hourly RSI – The RSI for ETH/USD climbed well above the 60 level and it is currently correcting lower towards 55.
Major Support Level – $132
Major Resistance Level – $135


