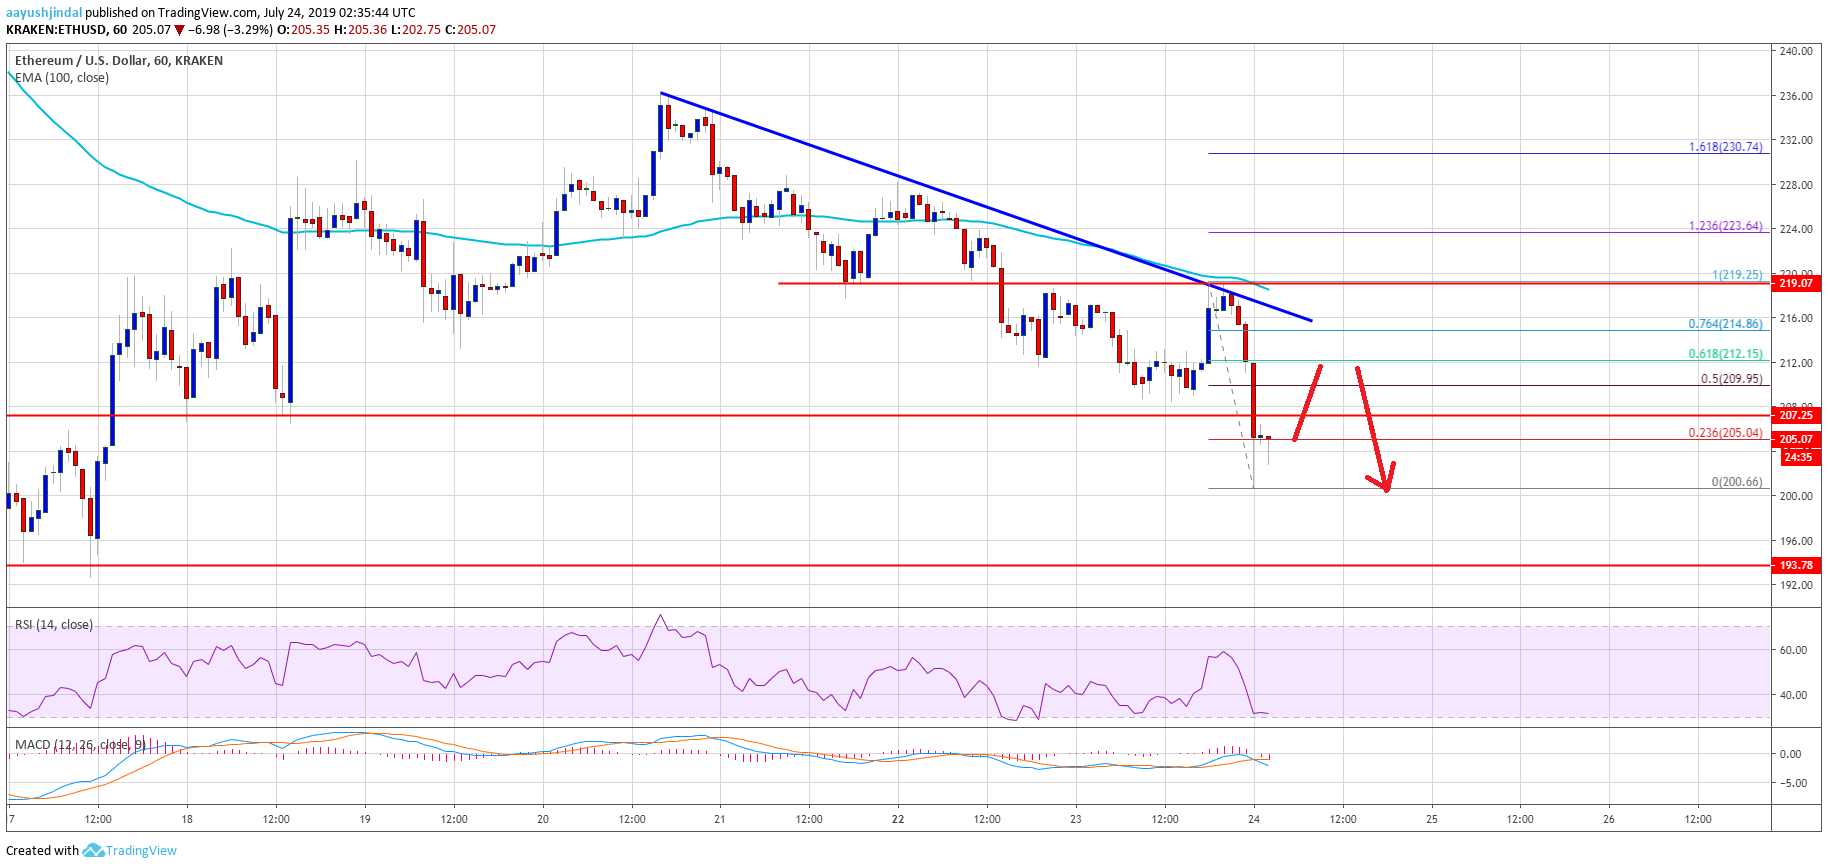
- ETH price remained in a bearish zone and broke the $208 support area against the US Dollar.
- The price tested the $200 support area and it remains at a risk of more losses.
- There is a major bearish trend line forming with resistance near $214 on the hourly chart of ETH/USD (data feed via Kraken).
- The pair is likely to continue lower and it seems like it might soon test the $190 support zone.
Ethereum price is currently trading with a bearish bias versus the US Dollar and bitcoin. ETH price might continue to slide as long as it is below $215 and $220.
Ethereum Price Analysis
This week, Ethereum price mostly traded with a bearish bias below $230 against the US Dollar. The ETH/USD pair broke a few important supports near $220 and $215 to enter a bearish zone. Moreover, there was a close below the $220 level and the 100 hourly simple moving average. The price is currently under a lot of pressure and it even broke the $208 support level.The bulls are currently defending the $200 support area, but the price remains at a risk of more losses. An immediate resistance is near the $210 level. The 50% Fib retracement level of the recent decline from the $220 high to $200 low is also near the $210 level to act as a resistance. The next key resistance is near the $215 level. Moreover, there is a major bearish trend line forming with resistance near $214 on the hourly chart of ETH/USD.
ETH Technical Indicators
Hourly MACD – The MACD for ETH/USD is gaining momentum in the bearish zone, with negative signs.
Hourly RSI – The RSI for ETH/USD is currently well below the 40 level, with a bearish angle.


