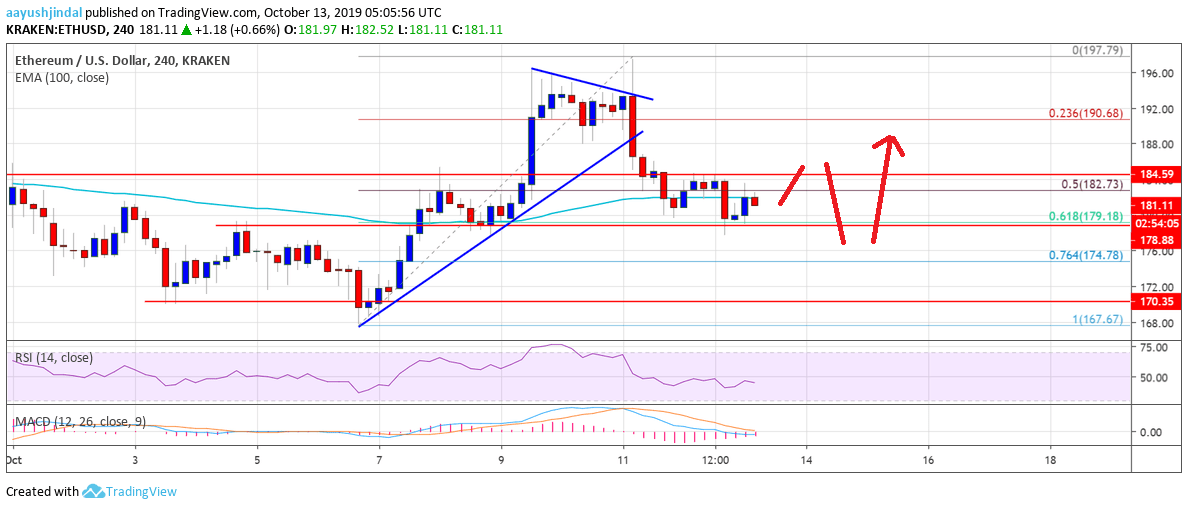
- ETH price started a sharp downside correction after trading as high as $198 against the US Dollar.
- The price is currently holding an important support area near the $180 level.
- There was a break below a major bullish trend line with support near $188 on the 4-hours chart of ETH/USD (data feed via Kraken).
- The pair could extend its decline towards the $175 support area before a fresh increase.
Ethereum price is struggling to retain its bullish bias against the US Dollar and bitcoin. ETH is likely to bounce back as long as it is above $175 and $180.
Ethereum Price Weekly Analysis
This past week, ETH started a strong rise above the $175 resistance against the US Dollar. Moreover, the pair broke the key $185 resistance area and settled above the 100 simple moving average (4-hours). It opened the doors for more gains above the $190 resistance. Finally, the price traded close to the $200 level and a new monthly high was formed near the $198 level.Later, there was a sharp decline in Ethereum and the price traded below the $185 support area. Additionally, there was a break below the 50% Fib retracement level of the last major wave from the $167 low to $198 high. More importantly, there was a break below a major bullish trend line with support near $188 on the 4-hours chart of ETH/USD. The price even spiked below the $182 support and the 100 SMA.


