Despite the recent gains posted, a particular technical indicator suggests that the scaling solutions token is poised to pull back.
OMG Reaches Overheated Territory
The Tom Demark (TD) Sequential indicator has proven to be essential in determining OMG’s price action. This technical index was able to predict the most significant exhaustion points on this altcoin’s 1-day chart over the last six months.The TD Index Estimates OMG Is Poised to Retrace. (Source: )
Stiff Support Ahead
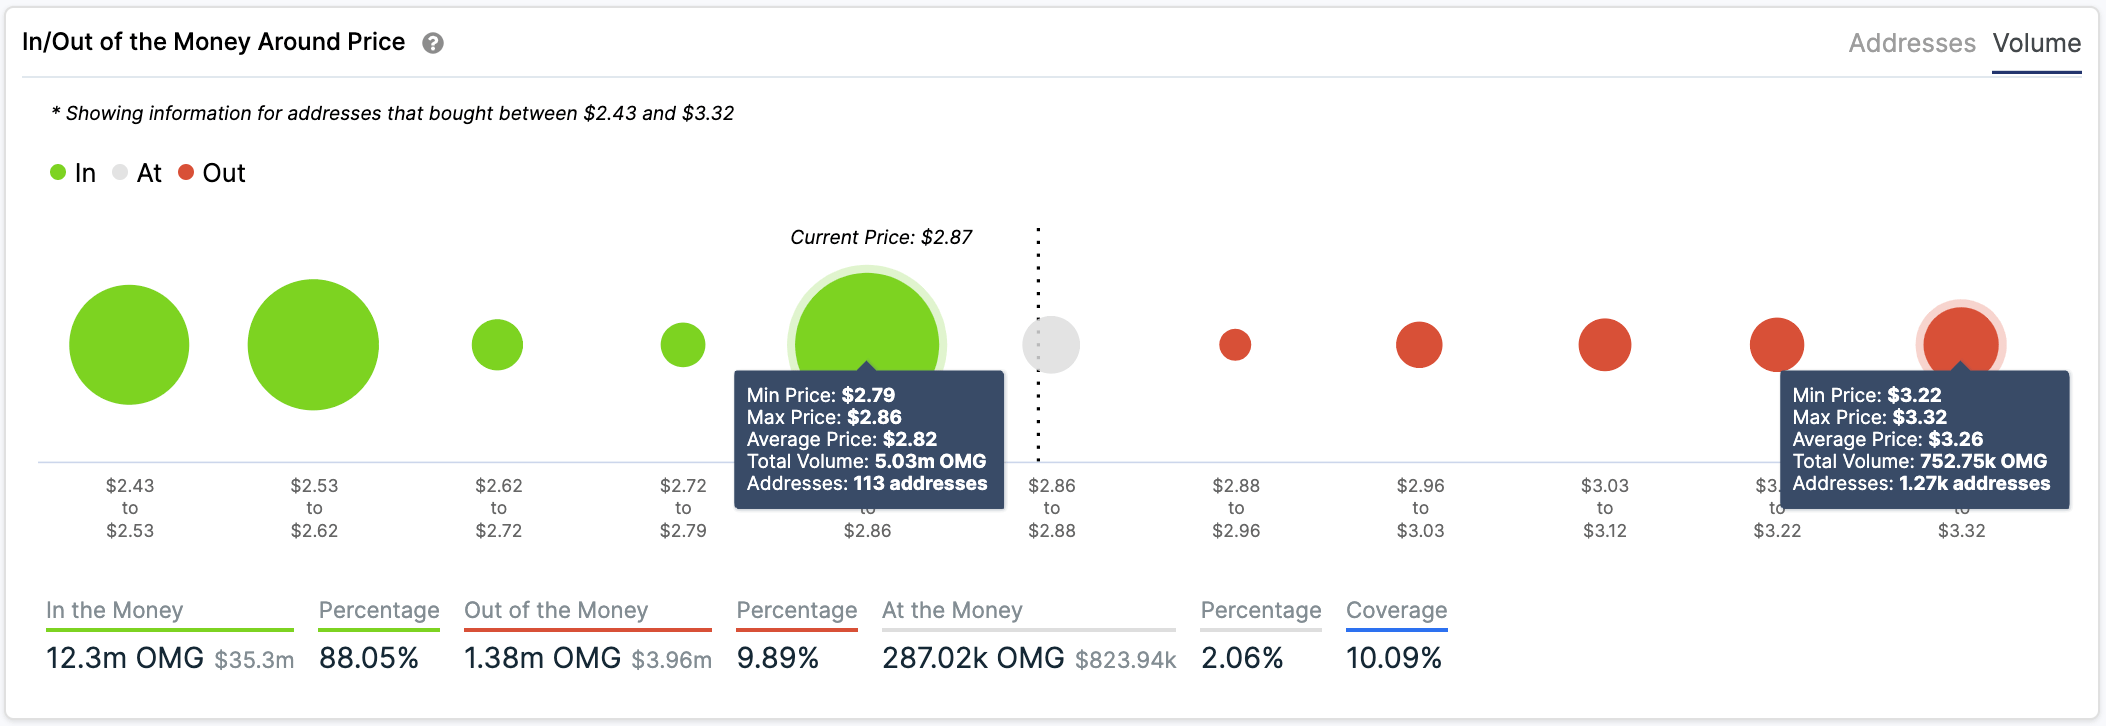
In the event of a correction, IntoTheBlock’s “In/Out of the Money Around Price” (IOMAP) model reveals that there is only one considerable support wall underneath OMG Network that could prevent it from dropping further. Based on this on-chain metric, over 110 addresses had previously purchased over more than 5 million OMG around $2.80. This supply barrier could have the ability to reject any downward price movement because holders within this range would likely try to remain profitable in their long positions. They may even buy more tokens to allow prices to rebound
OMG Faces Weak Resistance Ahead. (Source: )On the flip side, the IOMAP cohorts show that a there is not any supply barrier ahead of this altcoin that could prevent it from advancing further. Indeed, the most important resistance ahead of it lies around $3.30. Here, nearly 1,300 addresses bought over more than 750,000 OMG. Given the current market conditions, investors must implement a robust risk management strategy when trading OMG. Even though everything seems to point out that this token is poised to retrace, the lack of any important resistance ahead suggests that it could have more room to go up.
Featured Image by Depositphotos
Price tags: omgusd, omgbtc
Chart from


