PEPE Symmetrical Triangle May Hint At The Next Move For The Memecoin
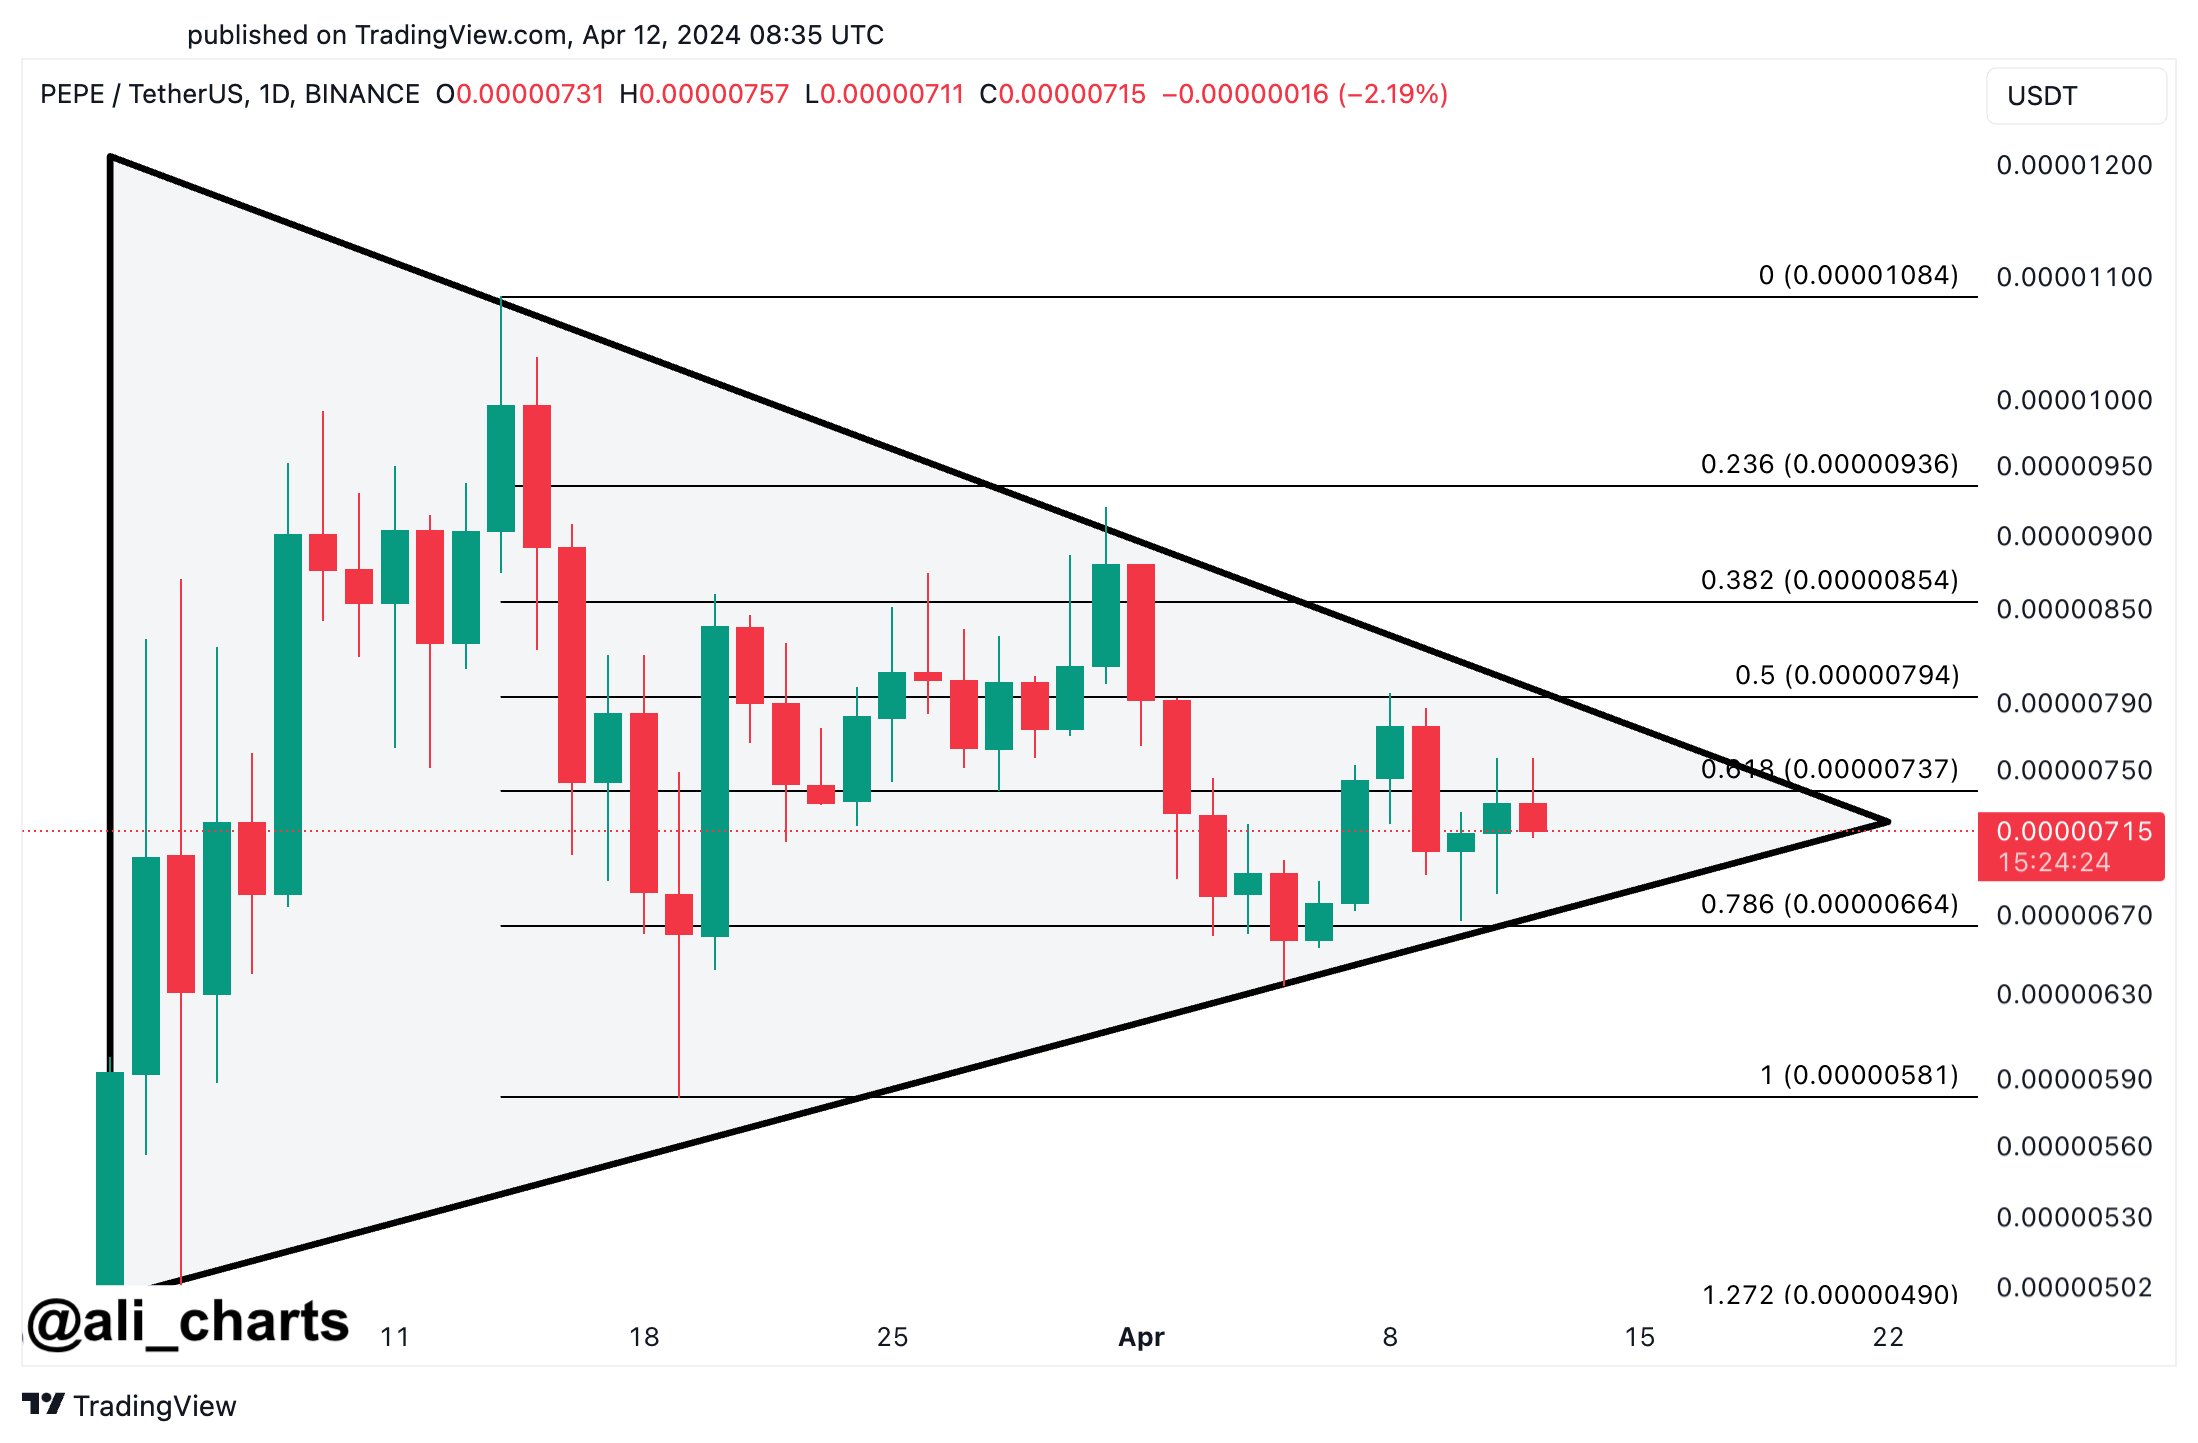
In a new on X, analyst Ali discussed the recent trend forming in the PEPE price. According to the analyst, the memecoin is currently forming a symmetrical triangle pattern on its one-day chart.The “symmetrical triangle” here refers to a pattern in technical analysis (TA) that, as its name suggests, looks like a triangle. In this pattern, there are two lines of interest between which the asset’s price consolidates for a period.
There are other triangle patterns in TA, but those have either differently angled lines (as is the case with wedges) or one line parallel to the time-axis (ascending and descending triangles).
Like other TA patterns that represent a consolidation phase, the lines of the symmetrical triangle also serve as a point of potential reversal for the price. The upper line usually offers resistance (meaning tops can occur), while the lower line may provide support (bottom formation).Looks like the asset's price is getting closer to the converging point of the pattern | Source:As is visible in the graph, the 1-day price of PEPE has been approaching the triangle’s apex recently, implying that a break in a direction may be coming for the memecoin. “Watch out for a daily close outside of the $0.00000793 – $0.00000664 range, which could lead to a 54% move for PEPE,” explains the analyst. Given the pattern that has been forming, it now remains to be seen how the asset’s price will play out from here.
PEPE Price
At the time of writing, PEPE is trading around $0.000006868072, up 3% over the past week.The price of the memecoin appears to have gone down recently | Source:


