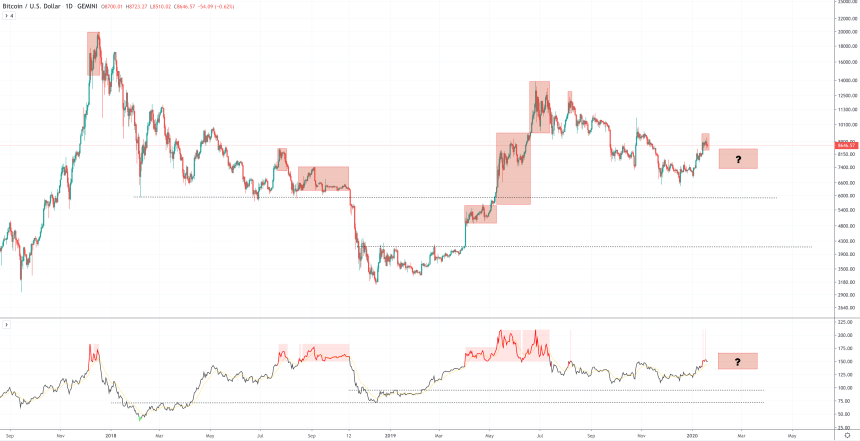
Bitcoin’s NVT ratio, or its network value to transactions ratio, can be used to signal tops and bottoms in the crypto asset with surprising accuracy.
Although the tool’s creator hasn’t been giving it much credence in the past, it has repeatedly signaled the top over the last two years of price action. Now, the signal is acting up once again, suggesting that Bitcoin has topped out and a deep, November 2018-style drop could be coming in the days ahead.
Bitcoin NVT Signals Top Is In, November 2018 Style Drop Could Follow
Bitcoin is a first of its kind financial asset, and therefore, unusual and unorthodox methods are used to perform fundamental analysis about the overall health of the asset and its underlying network.
Among the ways the Bitcoin protocol’s value is measured, is by comparing the asset’s current price in correlation with the overall value being transacted across the network, creating what is referred to as the NVT ratio, or network value to transactions ratio.
Related Reading | Bitcoin NVT Ratio: Top Predicting Signal Hits Highest Peak, Is a 50% Drop Ahead?
The higher this number, the more overvalued it suggests Bitcoin price is compared to the current value being transacted across the network.
Each time this number reaches a high, it typically signals that a top is in or near, and a deep drop isn’t far behind.
At the height of the crypto hype bubble, NVT began signaling that the crypto asset was significantly overvalued, and the bear market followed.
It wasn’t until July 2018 – a time period exhibiting price action eerily similar to the current market – that the signal suggested another top was in.
In the few months following, the indicator stayed overheated, suggesting a deeper drop was ahead. In November 2018, the unthinkable happened and support at $6,000 crumbled and Bitcoin fell to its current bear market low of $3,100.
After the crypto asset bottomed, it went on yet another parabolic rally, forming and echo bubble of its previous bull cycle.
And just like the previous bull cycle, as the rally began to peak, NVT began signaling a top was in once again, and the result has been a six-month-long downtrend.
It’s only now once again that Bitcoin is looking bullish, after an inverse head and shoulders confirmed – much as it did in July 2018 – that , and a drop may follow.

Across the crypto market, analysts have been calling attention to the many similarities between now and the July 2018 price action. After Bitcoin broke through downtrend resistance, it topped out at $8,500, before falling back to support and grinding against it until it finally broke down.
Related Reading | Bulls Beware: Last Bitcoin Downtrend Breakout Led To Bear Market Lows
If history repeats and the NVT signal confirms, Bitcoin could see a repeat of November 2018, causing one final massive dump and shakeout before the cycle starts up all over again.
