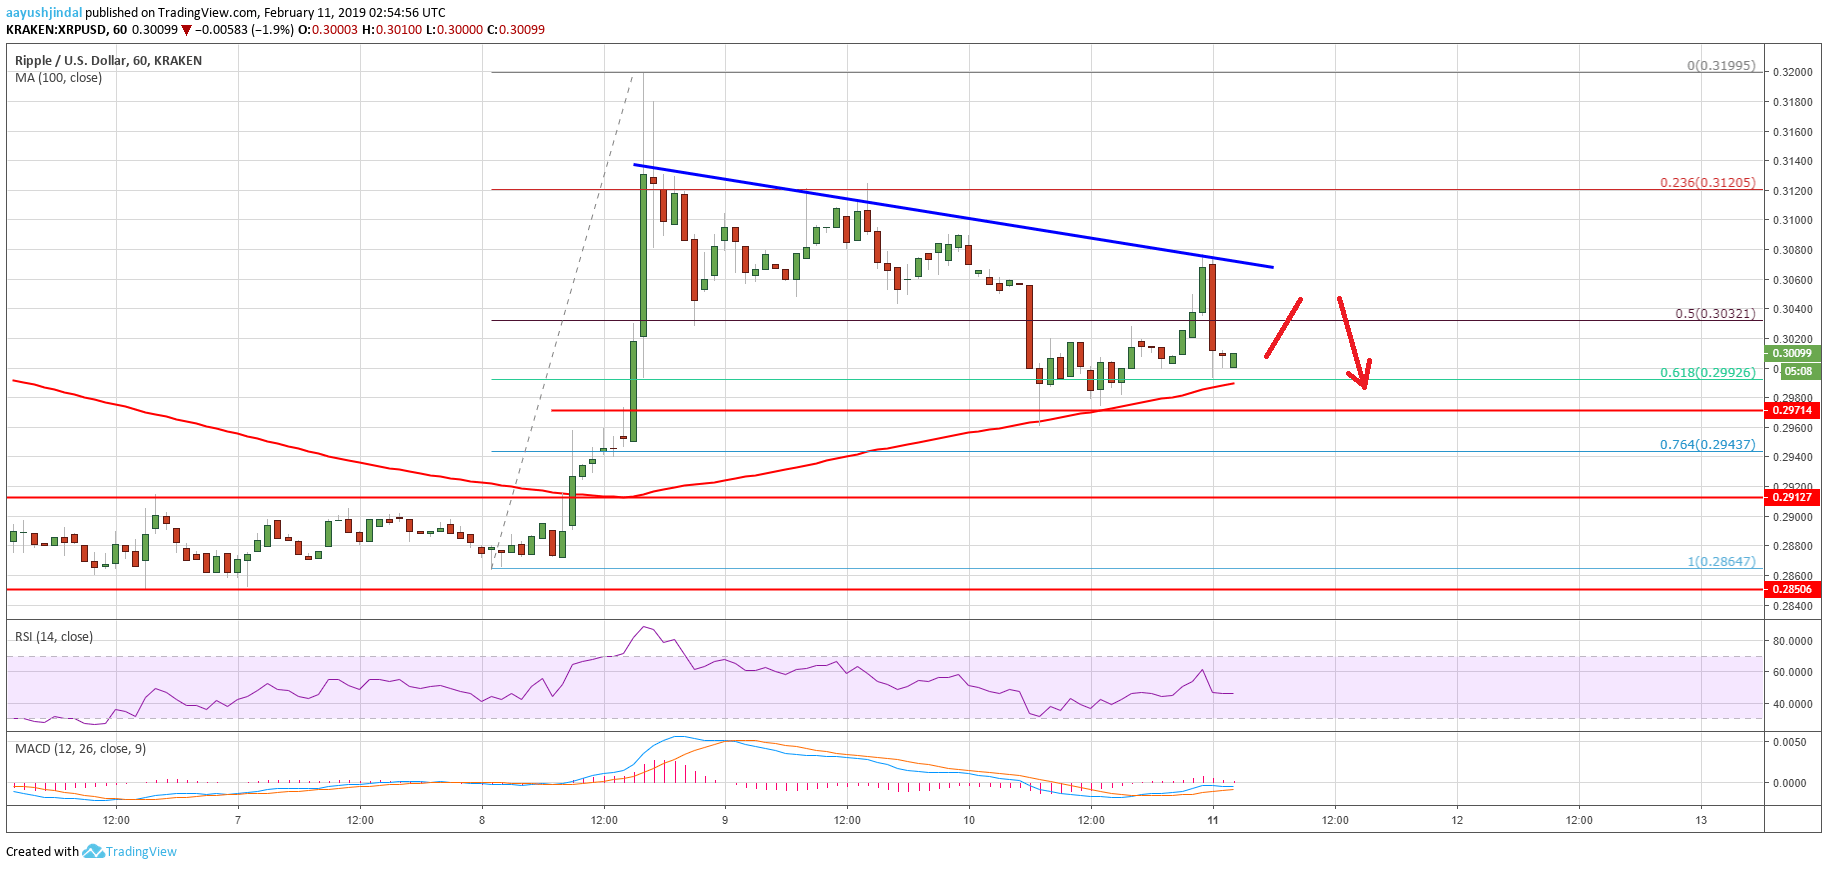
- Ripple price failed to retain gains and traded below the $0.3080 support against the US dollar.
- There is a key connecting bearish trend line in place with resistance at $0.3065 on the hourly chart of the XRP/USD pair (data source from Kraken).
- The pair must stay above the $0.3000 support and the 100 hourly simple moving average to bounce back.
Ripple price is currently correcting gains against the US Dollar and Bitcoin. XRP/USD is at a risk of a sharp decline if it breaks the 100 hourly SMA and $0.3000.
Ripple Price Analysis
The recent uptrend in bitcoin and Ethereum helped ripple price is climbing above $0.3000 against the US Dollar. The XRP/USD pair broke the $0.3100 resistance level and traded towards the $0.3200 level. A high was formed at $0.3199 and later the price corrected lower. It moved below the $0.3150 support and 50% Fib retracement level of the last wave from the $0.2864 low to $0.3199 high. The price even broke the $0.3000 support once and tested the 100 hourly simple moving average.
At the moment, it seems like the 100 hourly simple moving average is acting as a strong support above $0.3000. The 61.8% Fib retracement level of the last wave from the $0.2864 low to $0.3199 high also acted as a support. However, there are many resistances on the upside near the $0.3050 and $0.3060 levels. Besides, there is a key connecting bearish trend line in place with resistance at $0.3065 on the hourly chart of the XRP/USD pair. The pair needs to break the $0.3060 resistance and the bearish trend line to gain bullish momentum. If not, there is a risk of a downside break below the $0.3000 support.


