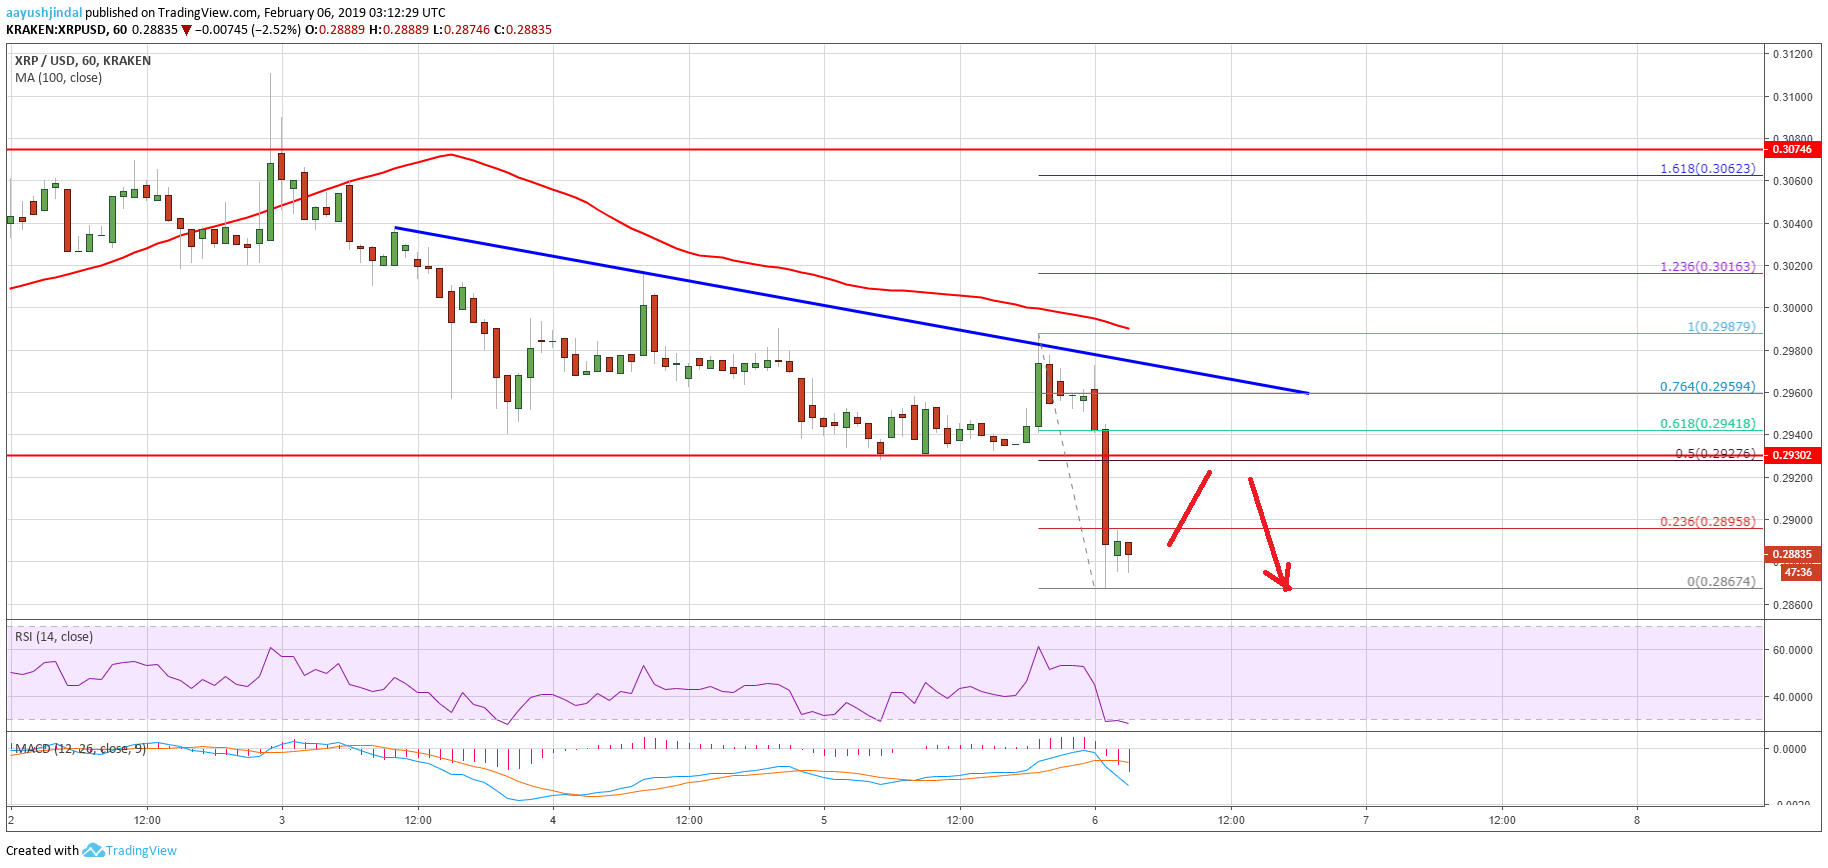
- Ripple price declined further and broke the $0.2940 and $0.2900 support levels against the US dollar.
- There is a key bearish trend line in place with resistance near $0.2960 on the hourly chart of the XRP/USD pair (data source from Kraken).
- The pair is trading in a bearish zone and it could continue to move down towards $0.2820 or $0.2800.
Ripple price accelerated losses against the US Dollar and Bitcoin. XRP/USD settled below $0.2940 and any recovery from the current levels could find a strong selling interest.
Ripple Price Analysis
There was a daily close below the $0.3000 support in ripple against the US Dollar. The XRP/USD pair declined further and broke many important supports near the $0.2900 level. Sellers were able to clear the key $0.2940 support and the 100 hourly simple moving average. It opened the doors for more losses and the price declined below the $0.2900 support level. It traded to a new monthly low at $0.2867 and it seems like sellers are in full control. At the moment, the price is consolidating losses above $0.2870, with no bullish angle.
An initial resistance is the 23.6% Fib retracement level of the recent decline from the $0.3110 high to $0.2940 low. However, the main resistances are near the $0.2920 and $0.2940 level. The previous support was also near $0.2940, which is likely to prevent gains. Besides, the 50% Fib retracement level of the recent decline from the $0.3110 high to $0.2940 low is near the $0.2930 level. Finally, there is a key bearish trend line in place with resistance near $0.2960 on the hourly chart of the XRP/USD pair. Therefore, if there is an upside correction, the price is likely to face sellers near $0.2920, $0.2930 and $0.2940.


