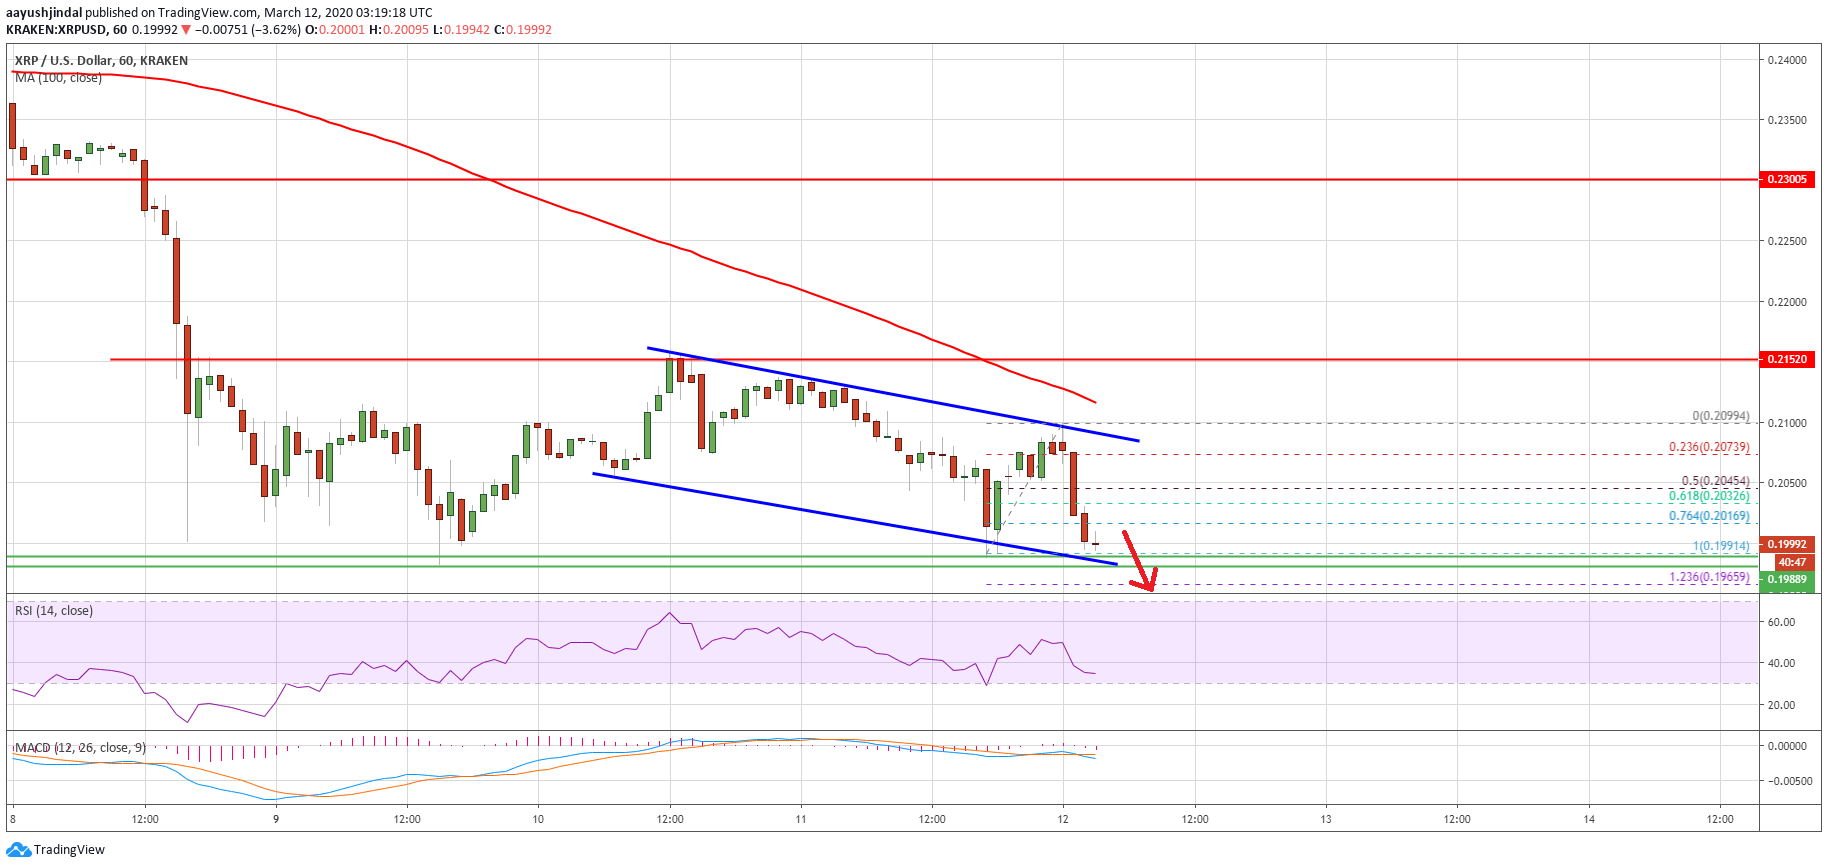
Ripple is showing a lot of bearish signs below the $0.2050 pivot area against the US Dollar. XRP price is vulnerable to a massive decline below the $0.2000 and $0.1980 support levels.
- Ripple price is declining and it is trading well below the $0.2100 resistance against the US dollar.
- The price is likely to dive below the $0.2000 and $0.1980 support levels in the near term.
- There is a major declining channel forming with resistance near $0.2070 on the hourly chart of the XRP/USD pair (data source from Kraken).
- The price could bounce if the bulls manages to protect $0.1980 once again.
Ripple Price Likely To Slide Further
In the past few days, ripple bears made a few attempts to push the price below the $0.2000 and $0.1980 support levels, but they failed. XRP price formed a high near the $0.2099 level and recently started a fresh decline.
There was a break below the $0.2050 pivot level. The price even declined below the 50% Fib retracement level of the recent rise from the $0.1991 low to $0.2099 high.
It seems like ripple bears are in control and they are attempting a bearish break below the $0.2000 and $0.1980 support levels. The price is currently testing the $0.1990 area and there is a major declining channel forming with resistance near $0.2070 on the hourly of the XRP/USD pair.

An initial support is near the $0.1965 level. It coincides with the 1.236 Fib extension level of the recent rise from the $0.1991 low to $0.2099 high.
The next key support is near the $0.1950 level, below which the price could test the $0.1920 level in the near term. Any further losses may perhaps lead the price towards the $0.1840 support level.
Another Rejection
There are also chances of another rejection near the $0.1980 support area. If ripple price stays above the $0.1980 support, it could start a short term upside correction.
On the upside, an initial resistance is near the $0.2050 level. The first key resistance is near the $0.2080 level and the channel upper trend line. A successful close above the channel resistance and a follow through above the $0.2100 resistance is needed to start a strong recovery wave in the coming sessions.
Technical Indicators
Hourly MACD – The MACD for XRP/USD is now gaining pace in the bearish zone.
Hourly RSI (Relative Strength Index) – The RSI for XRP/USD is now well below the 30 level.
Major Support Levels – $0.1980, $0.1965 and $0.1920.
Major Resistance Levels – $0.2050, $0.2080 and $0.2100.
