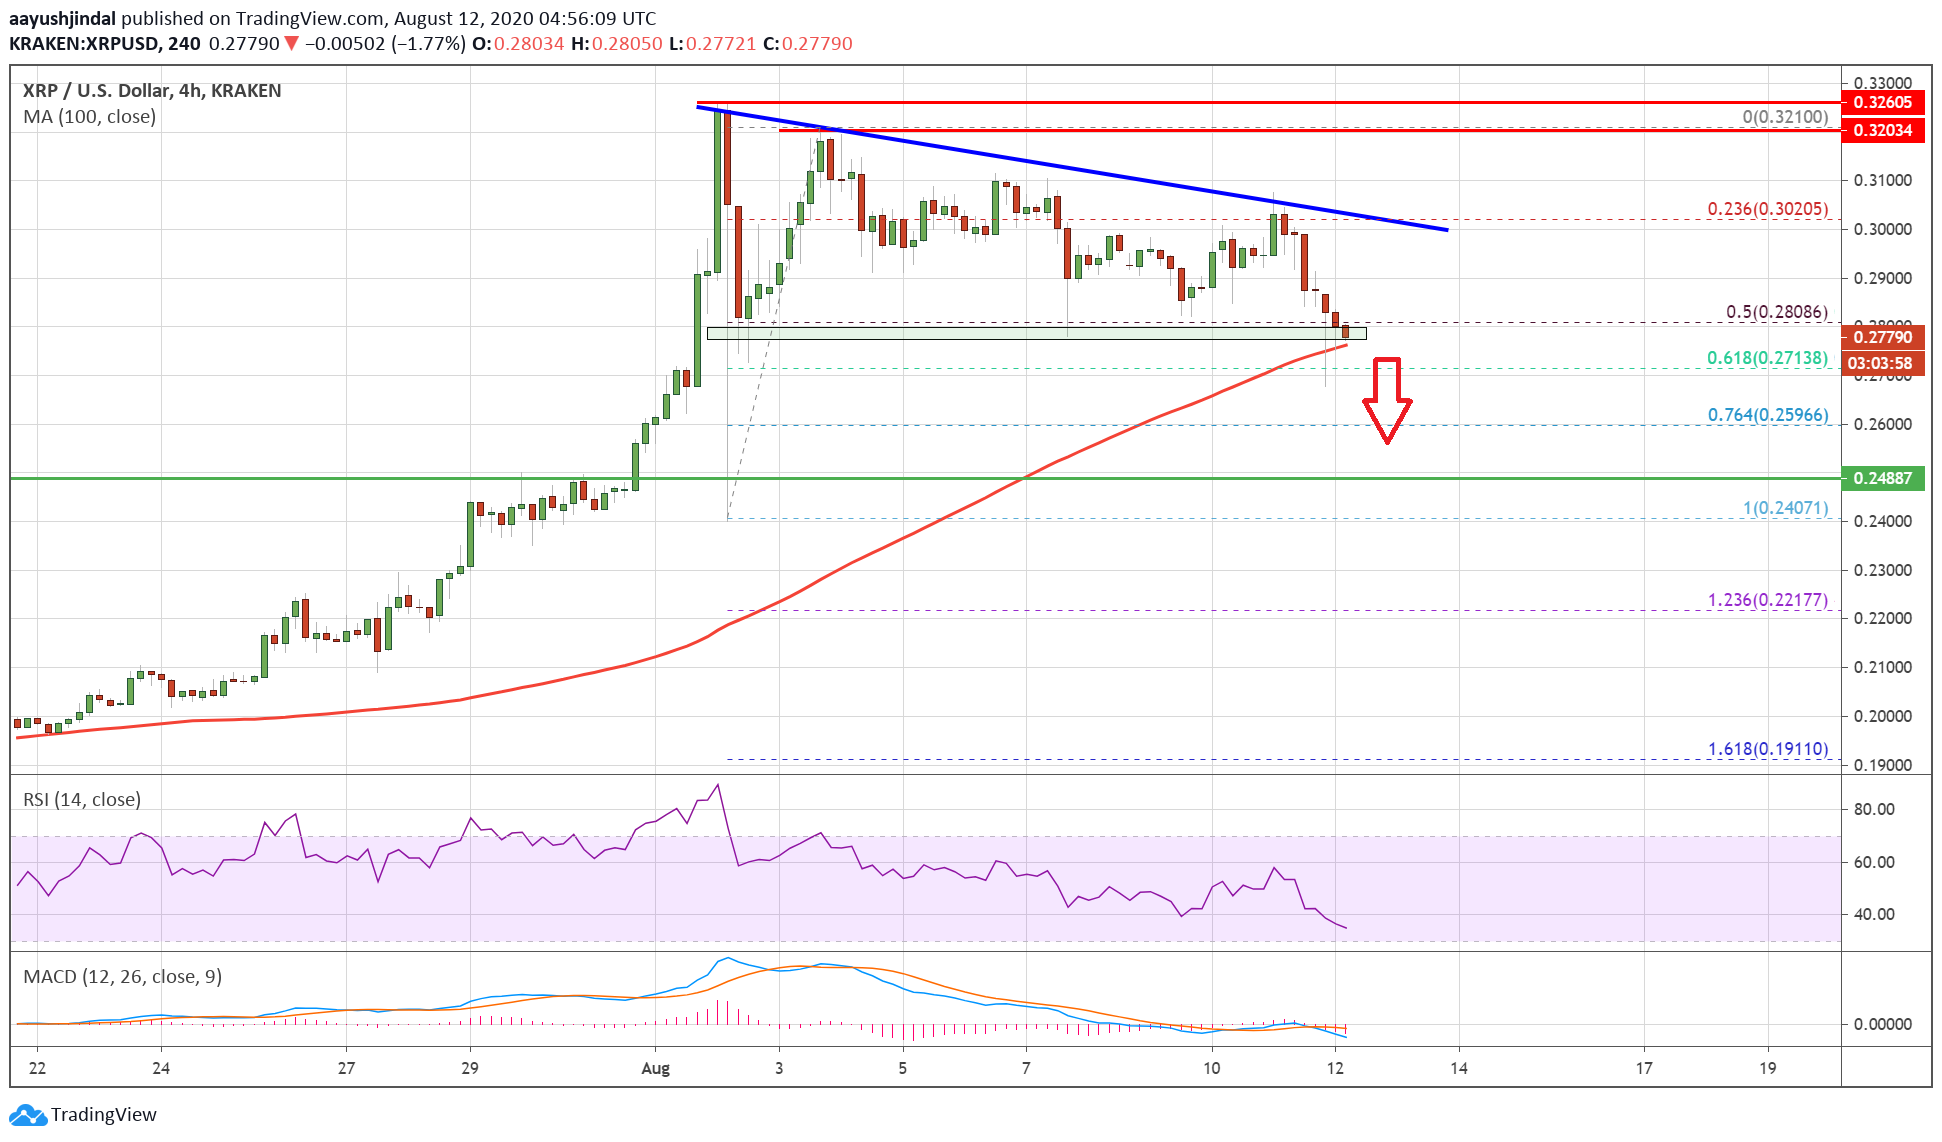
Ripple failed to clear the $0.3000 barrier and started a strong decline against the US Dollar. XRP price is down over 8% and it seems like the bears are aiming a test of the $0.2500 support.
- Ripple is declining and it is now trading well below the $0.3000 level against the US dollar.
- The price is currently approaching the $0.2750 support and the 100 SMA (H4).
- There is a key bearish trend line forming with resistance near $0.2980 on the 4-hours chart of the XRP/USD pair (data source from Kraken).
- The pair could decline further if there is a close below the $0.2750 and $0.2720 support levels.
Ripple Price Is Showing Bearish Signs
After a couple of failed attempts to clear the $0.3000 resistance, ripple started a fresh decline. The price broke the $0.2920 support level to move into a short-term bearish zone.
The bears gained strength and the price declined below the key $0.2850 support levels. The price even traded below the 50% Fib retracement level of the upward move from the $0.2407 low to $0.3210 high.
Moreover, there is a key bearish trend line forming with resistance near $0.2980 on the 4-hours chart of the XRP/USD pair. Ripple price is now trading near the $0.2780 level and the 100 simple moving average (4-hours).
Ripple (XRP) price trades below $0.2850. Source:
If there is a downside break, the price could continue to move down towards the $0.2720 support. The 61.8% Fib retracement level of the upward move from the $0.2407 low to $0.3210 high is also near the $0.2715 level.
A downside break below the $0.2720 and $0.2700 support levels, the price could continue to move down. The next major support is seen near the $0.2500 level (the last major breakout zone). Ant further losses may perhaps push the price back into a bearish zone.
Reversal in XRP?
If ripple stays above the 100 SMA (H4) or the $0.2720 support zone, the price could start a fresh increase. The first major resistance zone is near the $0.2850 level.
The main hurdle is still near the $0.3000 level and the bearish trend line. A successful close above the $0.3000 level is needed for a strong upward move in the coming sessions.
Technical Indicators
4-Hours MACD – The MACD for XRP/USD is now gaining strength in the bearish zone.
4-Hours RSI (Relative Strength Index) – The RSI for XRP/USD is now well below the 50 level.
Major Support Levels – $0.2750, $0.2720 and $0.2500.
Major Resistance Levels – $0.2850, $0.2920 and $0.3000.

