XRP price started a downside correction from the $0.750 zone. The price retested the $0.600 support zone and might soon attempt a fresh rally.
- XRP started a downside correction from the $0.750 resistance zone.
- The price is now trading below $0.650 and the 100 simple moving average (4 hours).
- There is a major bearish trend line forming with resistance near $0.6550 on the 4-hour chart of the XRP/USD pair (data source from Kraken).
- The pair might correct further lower, but the bulls could remain active near $0.600.
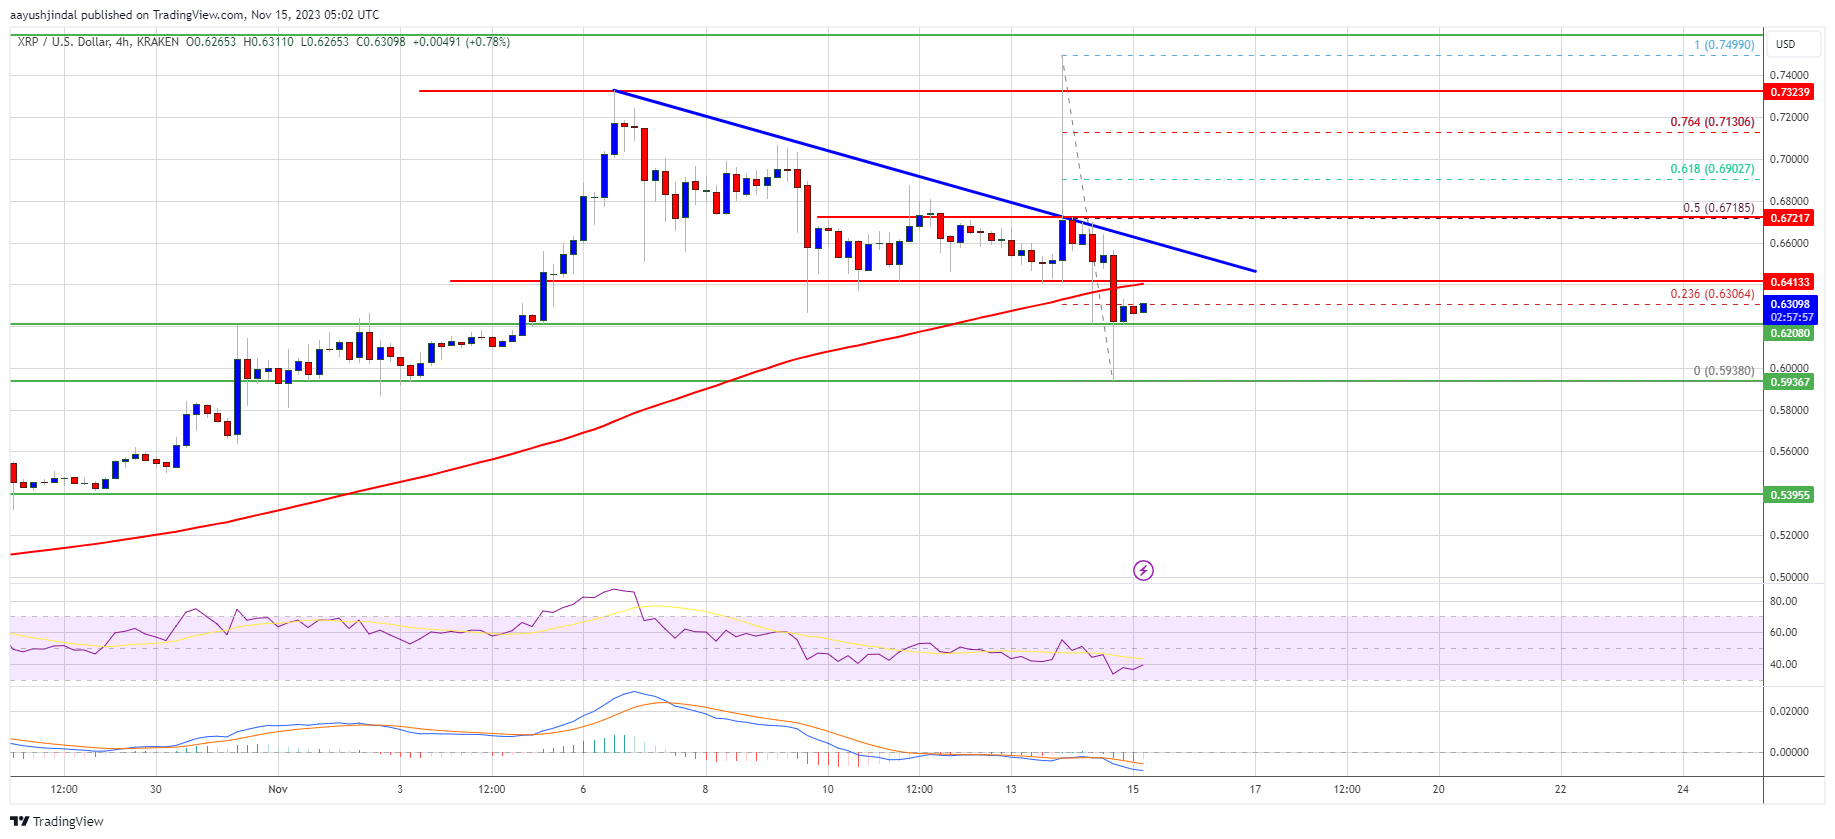
XRP Price Dips Below $0.650
After rallying above the $0.720 resistance, XRP faced resistance. The price struggled to clear the $0.750 barrier and recently started a downside correction, like Bitcoin and Ethereum.
The price declined below the $0.720 and $0.700 support levels. The bears even pushed it below the $0.650 pivot level. However, the bulls were active near the $0.600 zone. A low is formed near $0.5938 and the price is now attempting a fresh increase. XRP is now trading below $0.650 and the 100 simple moving average (4 hours). There is also a major bearish trend line forming with resistance near $0.6550 on the 4-hour chart of the XRP/USD pair. On the upside, immediate resistance is near the $0.630 level or the 23.6% Fib retracement level of the recent decline from the $0.7499 swing high to the $0.5938 low. The first major resistance is near the $0.640 zone or the trend line.