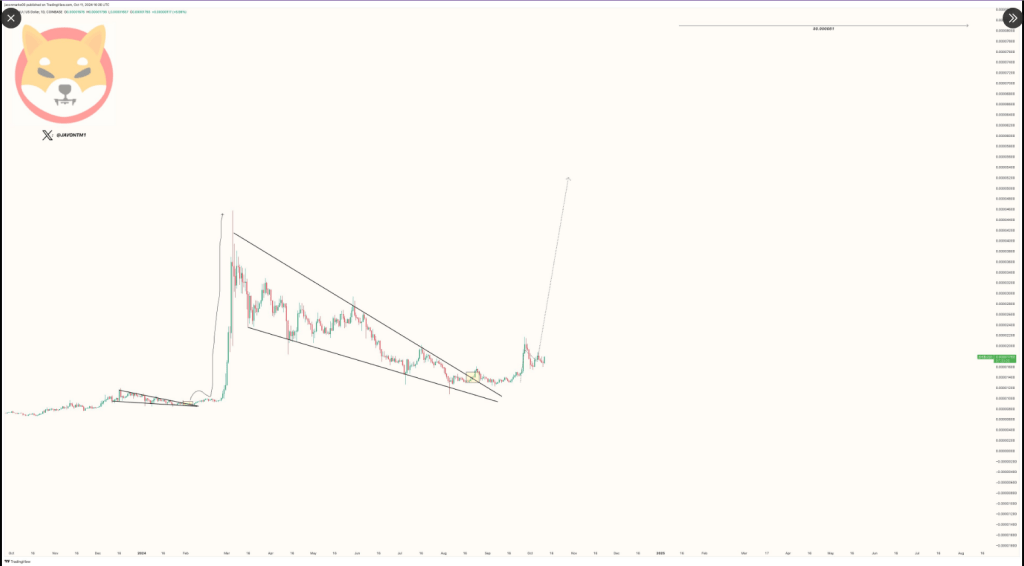
(Shiba Inu) – Are you prepared for $0.000081!? With SHIB broken out of a recent Falling Wedge pattern and a much larger (unpictured) resisting trend, an over 342% run from here to it could happen ASAP, and this falling wedge break may only help spark the process 🧨! — JAVON⚡️MARKS (@JavonTM1)

The Power Of A Falling Wedge
For the last five months, SHIB has been in a falling wedge pattern, which is a chart pattern in technical analysis that normally trends with a strong bullish reversal. As such, this particular pattern, where the lows are lower and the highs are lower, has proven to be a trigger for breakouts. In March 2024, the pattern was apparently clear, as SHIB declined from the yearly high at $0.000045. According to Marks, it may be the breakthrough that pushes the token all the way to $0.000081.Key Indicators Point To Strength
Momentum may be emerging as SHIB trades around $0.00001785 with persistent higher lows. Additionally, the token’s 50-day and 100-day Exponential Moving Averages (EMAs) are lower than the current price, suggesting bullishness. The fact that SHIB is still trading above its 200-day Simple Moving Average (SMA) indicates that it is in an uptrend over the long term, despite the fact that it is trading below its 50-day SMA, which is often a bearish signal. The confluence of these indicators indicates that SHIB is stable, although it is possible for it to move farther in any direction.Support And Resistance Levels
Looking forward, Shiba Inu has important support around $0.000017; resistance at $0.000018 and $0.000019. Should the token be able to surpass these resistance thresholds, it may rapidly achieve the target anticipated at $0.000081. Meanwhile, there still is room for development, but traders and investors should continue to watch closely the activity of the price because the next steps for SHIB can validate the breakout or trigger even more consolidation. Yet considering past trends and technical hints that look hopeful, it might be just a matter of time before SHIB explodes into significant value soon.Featured image from Pexels, chart from TradingView
