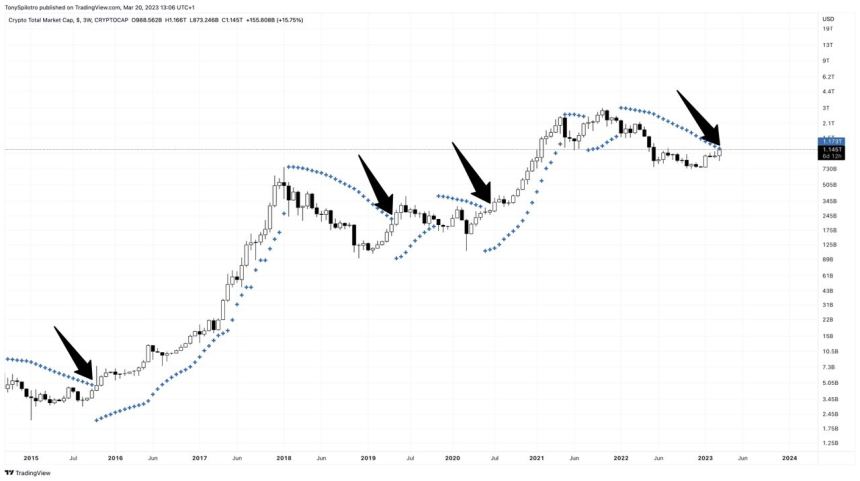
Bitcoin price has begun to take off like a rocket, but the rest of the crypto market has remained at a crawl.
However, if the TOTAL crypto market cap chart from TradingView moves much higher, it could break a key level that in the past reversed the downtrend and sent the market “parabolic.”Total Crypto Market To Trigger Parabolic SAR
The beginnings of a cryptocurrency bull market could be upon us, but you might not know it just yet. Unless you are looking at Bitcoin, that is.
The rest of crypto is slightly behind, but could soon start another parabolic rally, if TOTAL crypto market price action can tag the Parabolic SAR indicator on the 3-week timeframe.
BTCUSD has already reached the trigger level causing the SAR indicator to change directions and begin to appear below price action. Will the total crypto market cap chart do so next and what might that mean for performance?
The crypto market could go totally parabolic |
Could This Be The Sign The Trend Has Officially Reversed?
The Parabolic SAR tells traders when the previous trend has stopped, and officially reversed. Created by J. Welles Wilder, the Parabolic SAR is said to be shockingly accurate. So accurate, it is often used as part of a trailing stop loss strategy.
Wilder also created the Relative Strength Index, Average True Range, and many others. His tools are core tenets of technical analysis and some of the most popular and reliable today.


