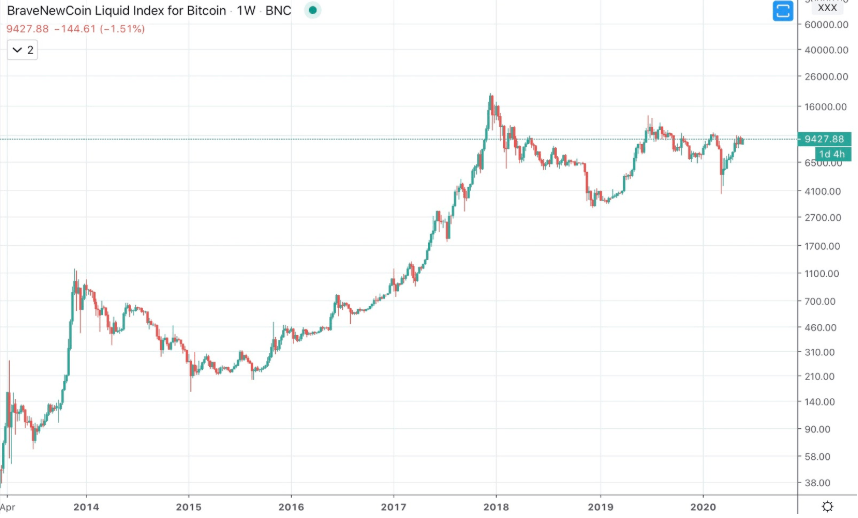
Technical analysis always starts with an asset’s price chart. However, the type of analysis done is altered significantly depending on the type of chart selected.
Common chart types include line charts, bar charts, point and figure, and candlesticks. More obscure kinds of charts include Renko, Kagi, and Heiken Ashi.
One platform that offers all of these chart types and technical features is .


